Soil Health
- Introduction
- Section 1: Explore the general soil properties of your soil online
- Section 2: Take a soil sample
- Section 3: Know what analyses to request and which laboratories to consider
- Section 4: How to interpret soil analyses
- Section 5: Suggested management practices to improve soil health
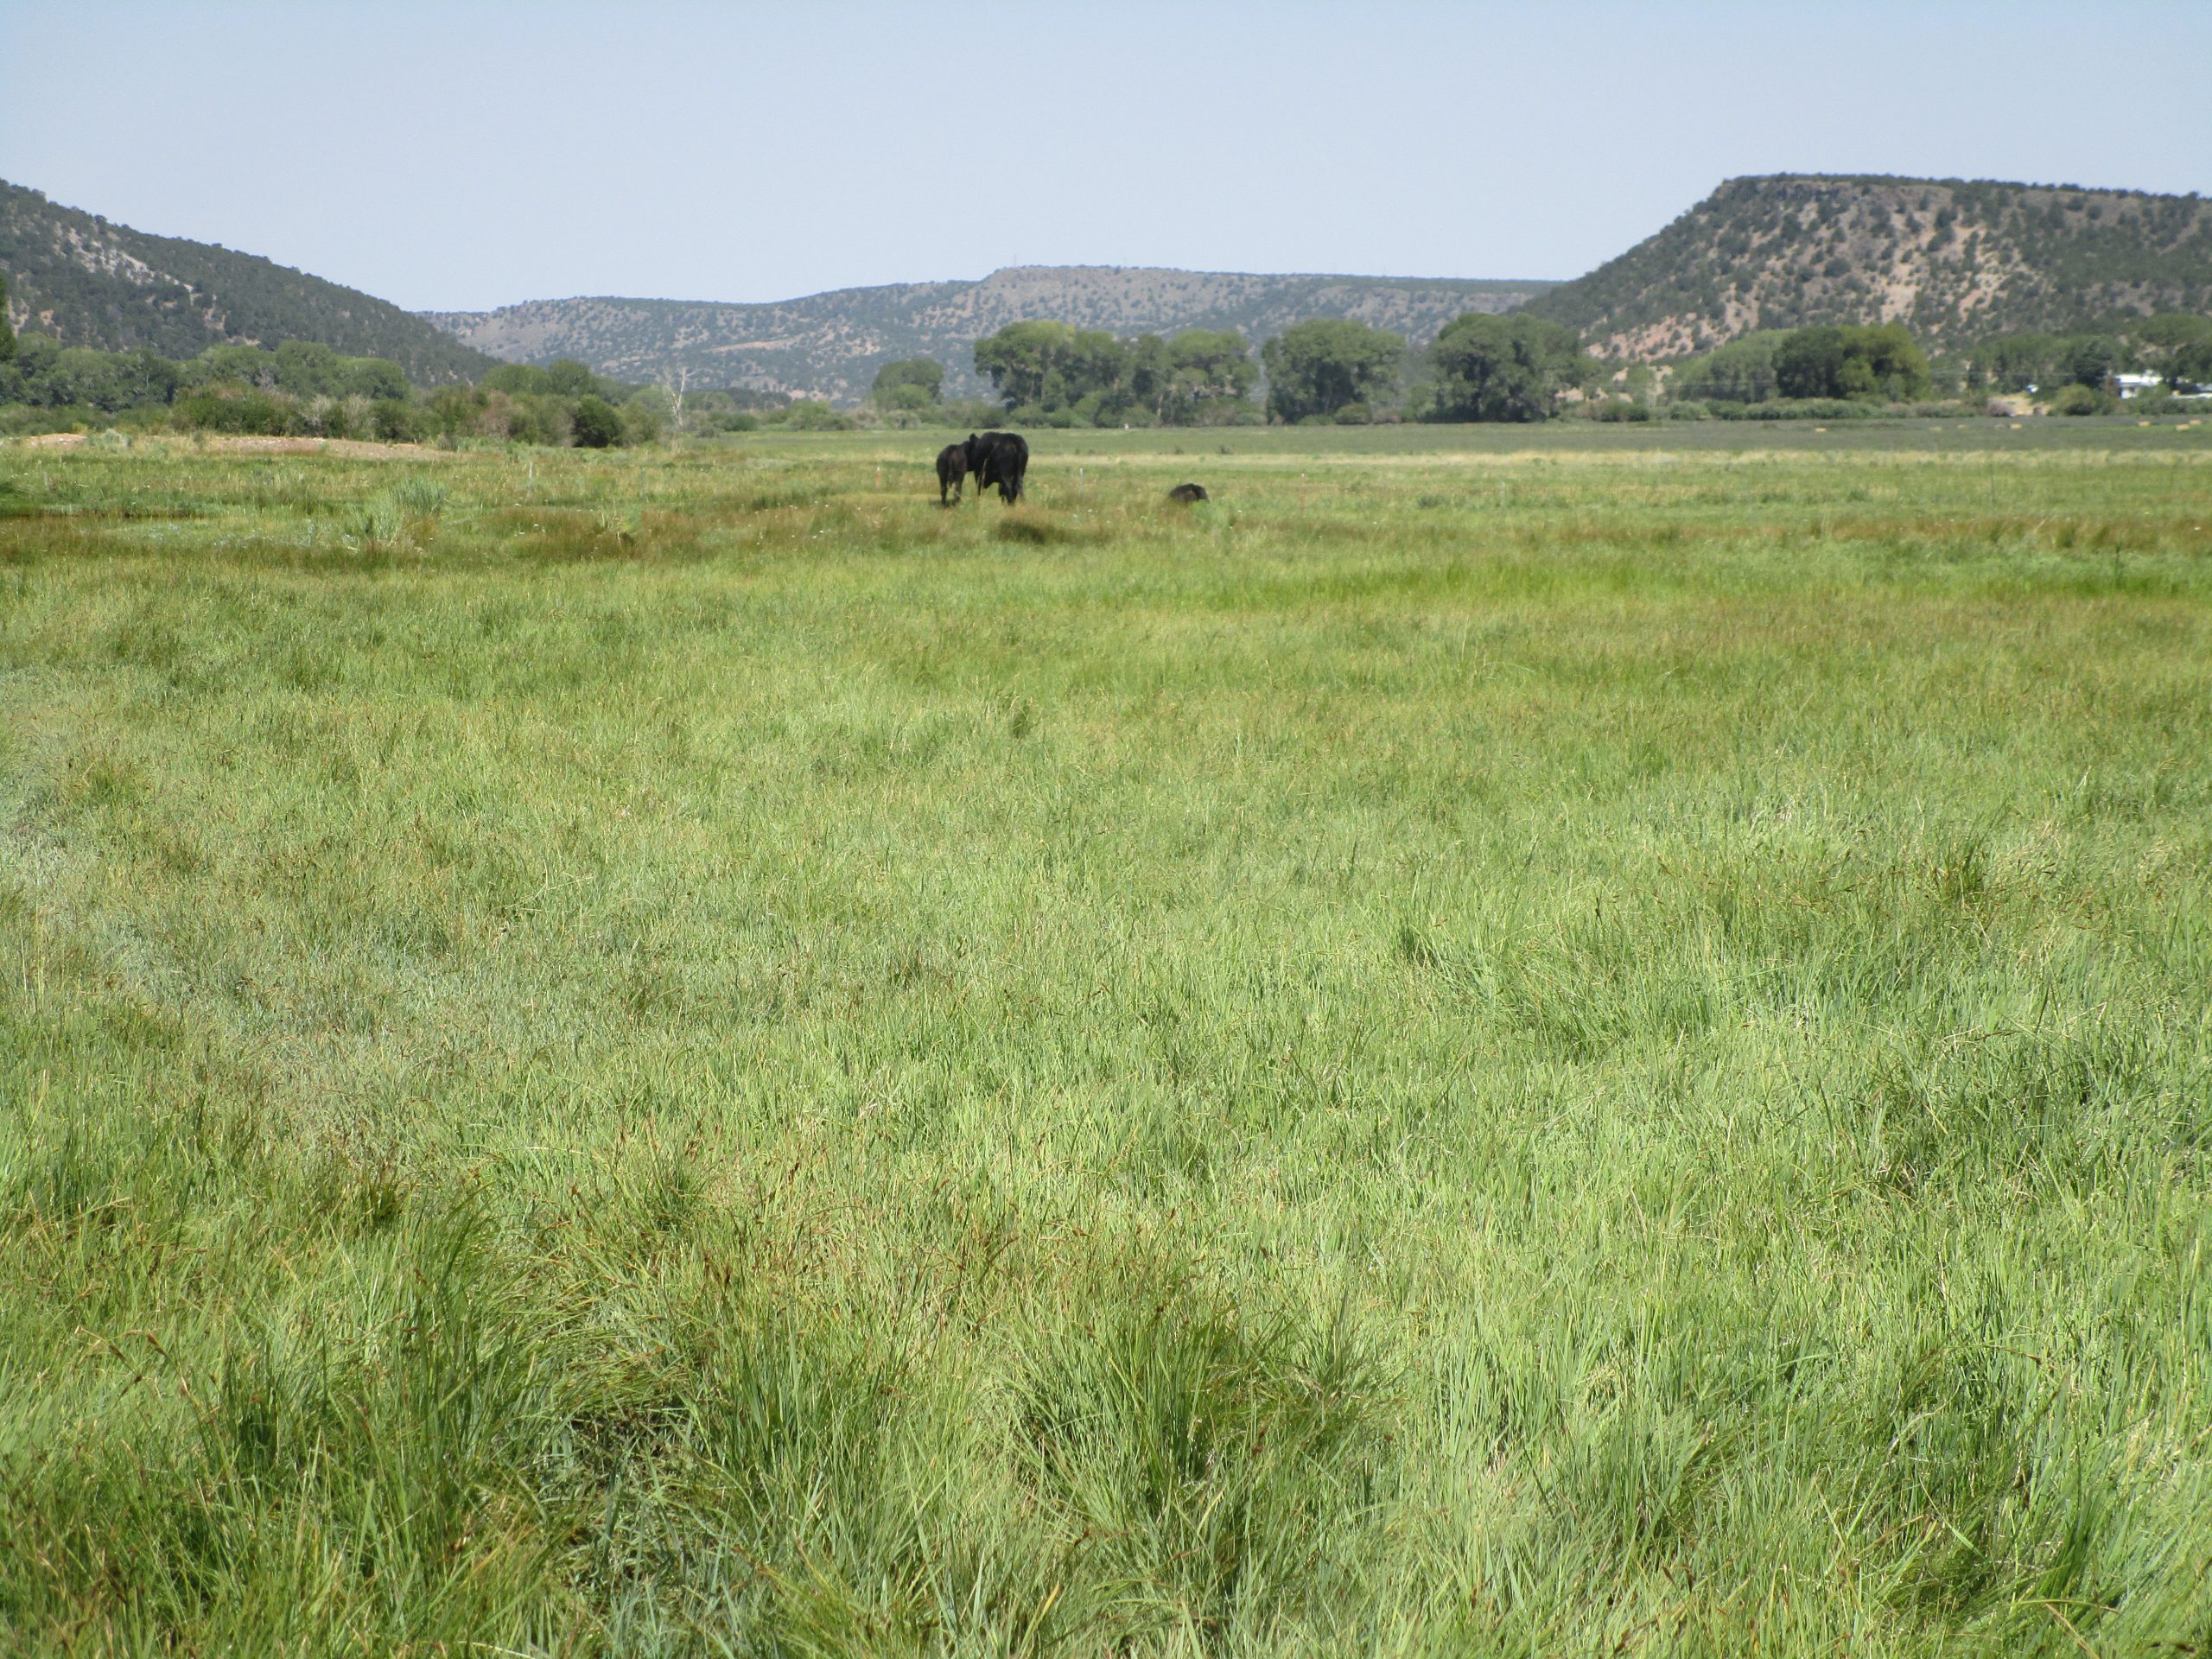
Keeping the soil covered is one of the main principles of soil health (click here for more info. on the benefits of soil cover) and vital for saving precious moisture in our dry and often windy environment.
2022-23 Winter Cover Cropping Project
The window to participate in the 2022-23 Winter Cover Cropping Project is now closed. Over the next 10 months, Taos SWCD is partnering with 55 cooperators to evaluate winter cover crops as a tool for soil building. Results of this special soil health project will be reported in the fall of 2023.
Project Background Cover cropping with oats, especially in newly seeded alfalfa fields, is a common practice locally. Taos SWCD, with support from NMDA’s Healthy Soil Program, is testing additional cover crop options and seeding methods to determine benefits to soil health on impaired agricultural lands. The use of winter cover crops, such as cereal rye, hairy vetch & triticale, may be a useful tool for improving soil conditions in situations with exposed soil and limited water.
“Soil is a living, breathing system. Sometimes we have to feed it a little for it to feed us” Dan DeSutter, Indiana Farmer
interviewed in the Living Soil Film (Soil Health Institute 2018)
Soil is a diverse natural system made up of minerals, organic matter, living organisms, air, and water. These components function together to provide ecosystem services that we depend on – water purification, nutrient cycling, carbon sequestration, food, fiber, fuel provisions and more. By managing for soil health, we can restore, conserve, and optimize these services (What are Soils?).
“Soil health, also referred to as soil quality, is defined as the continued capacity of soil to function as a vital living ecosystem that sustains plants, animals, and humans. This definition speaks to the importance of managing soils so they are sustainable for future generations (Healthy Soil for Life).“
Soil is alive. The role and importance of the living or biological component of soil is gaining attention as more research is revealing the contributions of soil organisms to plant health and production (Plant Microbe Engineering: Expected Benefits for Improved Crop Growth and Resilience). Healthy soil has millions of living organisms like earthworms, insects, bacteria, and fungi. In fact, there can be up to 1 billion bacteria and other organisms in one teaspoon of soil (NACD). Some of these bacteria and other soil organisms provide essential nutrients to plants. In exchange, plants provide carbon (a product of photosynthesis), which is used as an energy source by the soil organisms. It is essential to have year-round plant cover in order to maintain the input of carbon to the soil. Cover crops (any living ground cover planted for the benefit of the soil i.e. oats, radish, clover, ect.) can be planted to achieve year-round plant cover and are one example of a best management practice to improve soil health. By planting cover crops, we maintain the input of carbon into the soil. We feed the soil so that it can feed us (Living Soil).
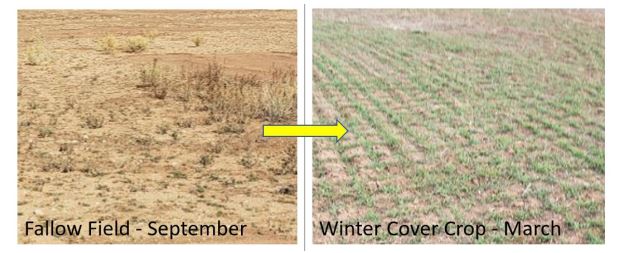
In addition, cover crops can be used for forage and weed suppression (Figures 1-3) (Discover the Cover: Managing Cover Crops to Suppress Weeds and Save Money on Herbicides). The use of cover crops in fallow (unplanted) fields is especially beneficial as the cover crop will hold the valuable nutrient rich top soil in place and prevent weeds from taking over (Soil Health at Risk in Fallow Fields). Austrian winter pea, for example, can be grazed and can also suppress weeds because of its rapid growth. Austrian winter pea is cold and drought tolerant and is an excellent choice for a winter annual in New Mexico. Pictured is Austrian winter pea in a cover crop mix with berseem clover that provides nitrogen fixation, annual ryegrass that builds organic matter, winter triticale (a cross of durum wheat and rye) that also provides weed suppression and forage, and turnip and daikon radish which break soil compaction (Principles of Cover Cropping for Arid and Semi-arid Farming Systems).
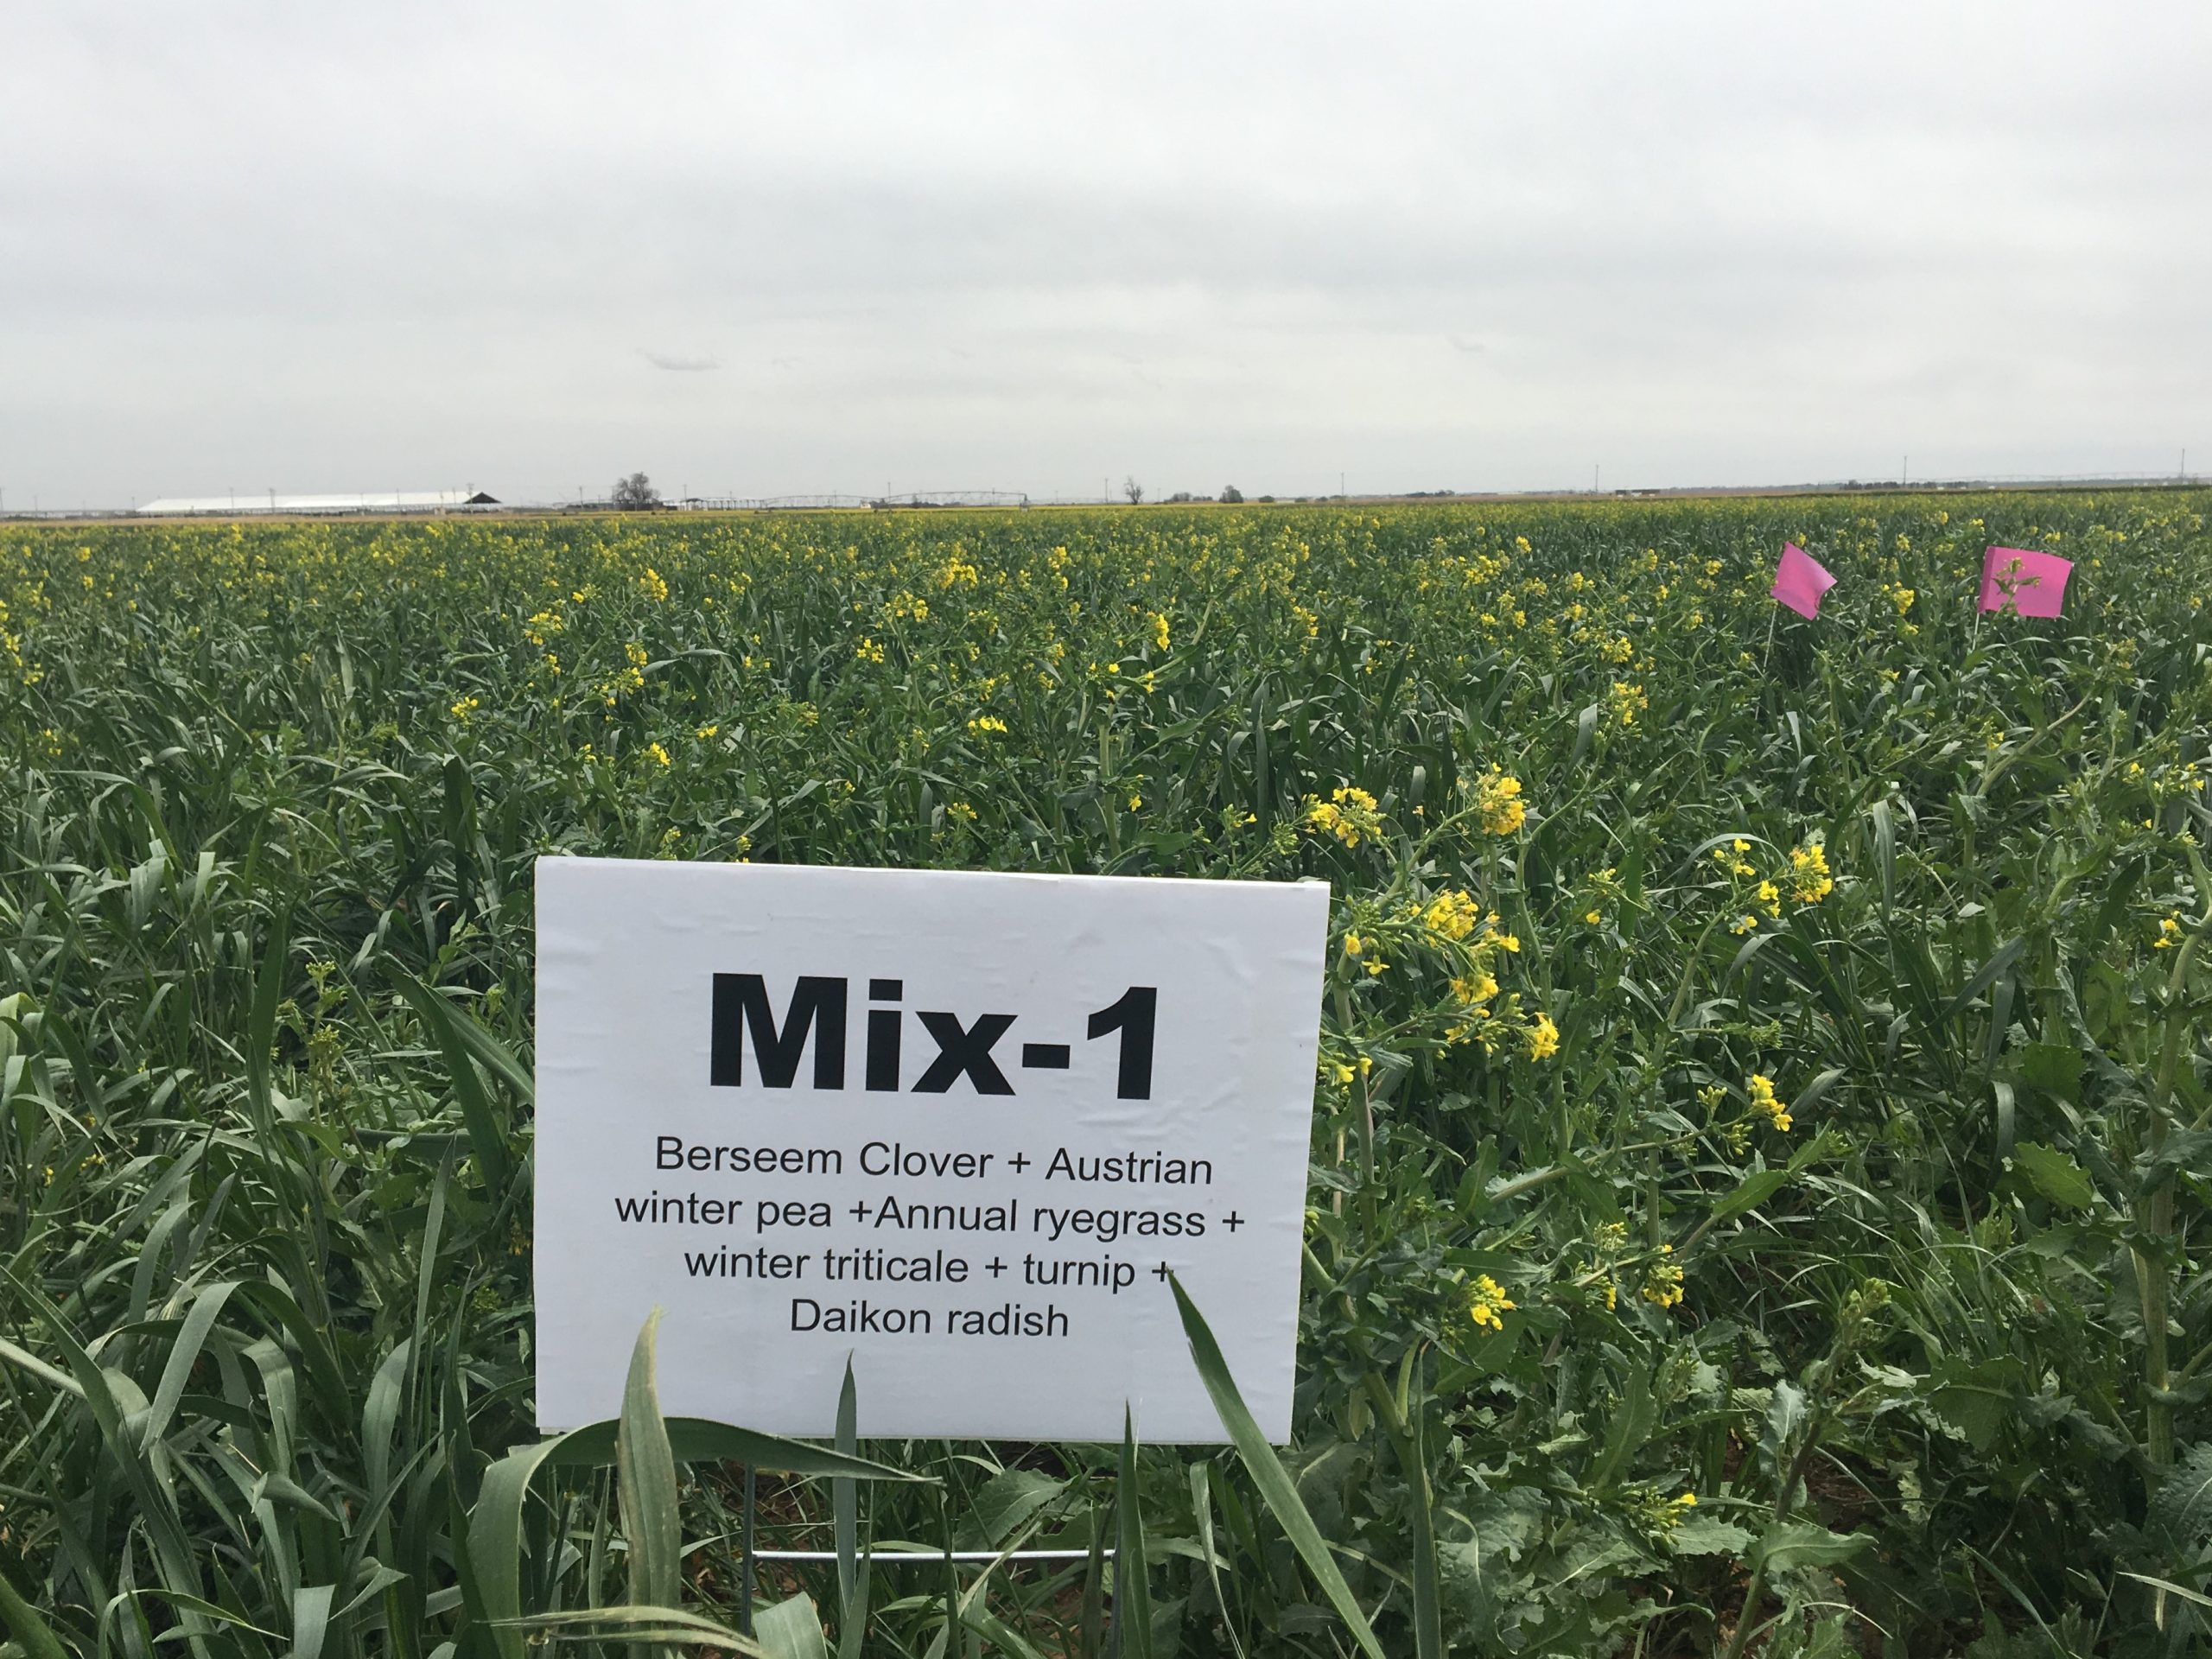
Figure 1: Cover crop mix with Austrian winter pea. Source Rajan Ghimire – NMSU Agricultural Science Center Clovis NM.
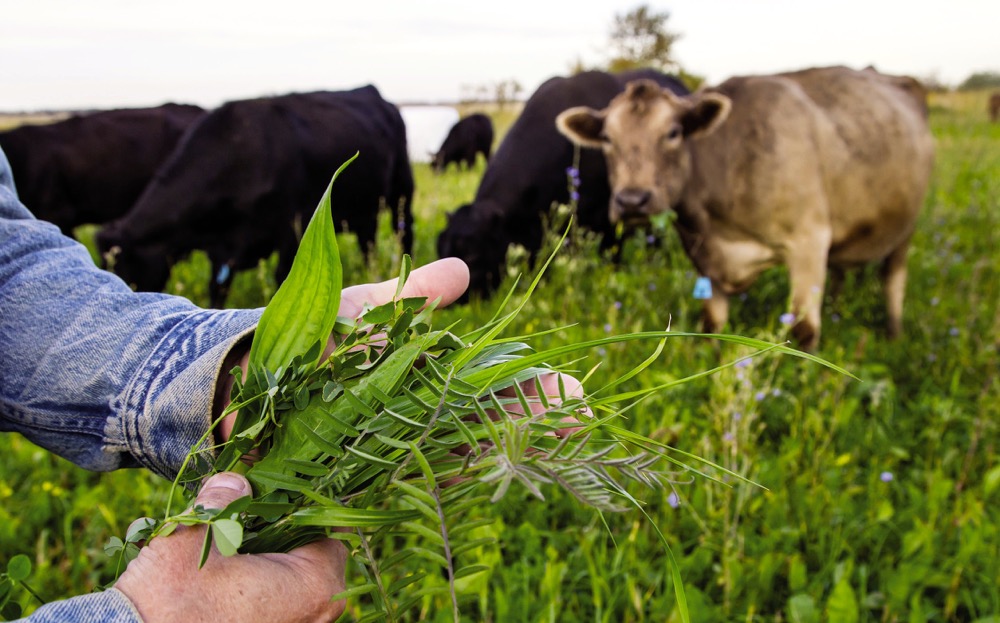
Figure 2: Cover crops with forage species can provide alternate feed source for winter (The forage value of cover crops
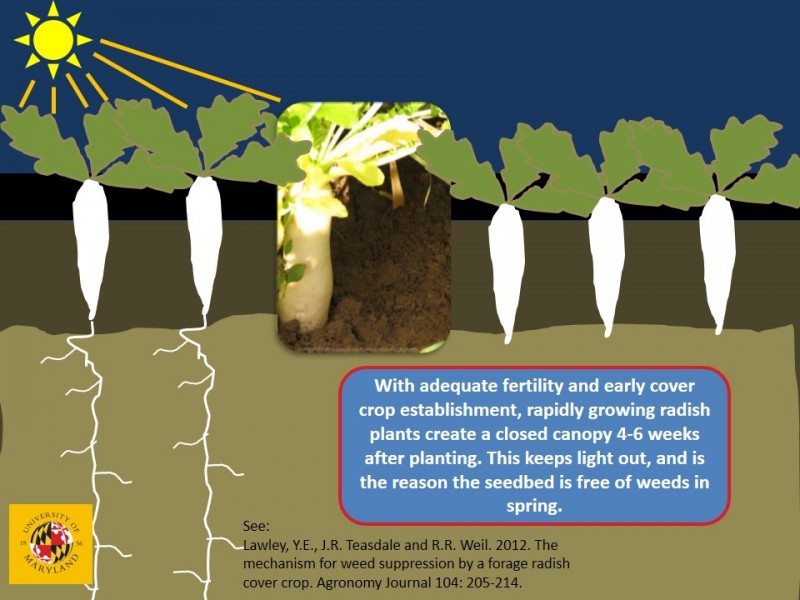
Figure 3: Cover crops provide weed suppression by out-competing weeds for sunlight and nutrients (Weed Suppression by Cover Crops).
Cover crops that include legumes (such as field peas, clover, or hairy vetch) can form mutually beneficial associations with a soil bacteria called Rhizobia (Figures 4 and 5). Rhizobia are some of the most useful soil bacteria to plant production. These bacteria are able to fix nitrogen-which means that they can convert otherwise unavailable atmospheric nitrogen to a form of nitrogen that plants can uptake. Healthy soil may have enough Rhizobia to colonize the roots of legumes and enrich both the plant and the soil with nitrogen (Rhizobia and Nitrogen Fixation). Cover crops also stimulate beneficial mycorrhizal fungi in the soil that are vital for nutrient uptake (Figure 6) (Cover Crop Determine AMF Community).
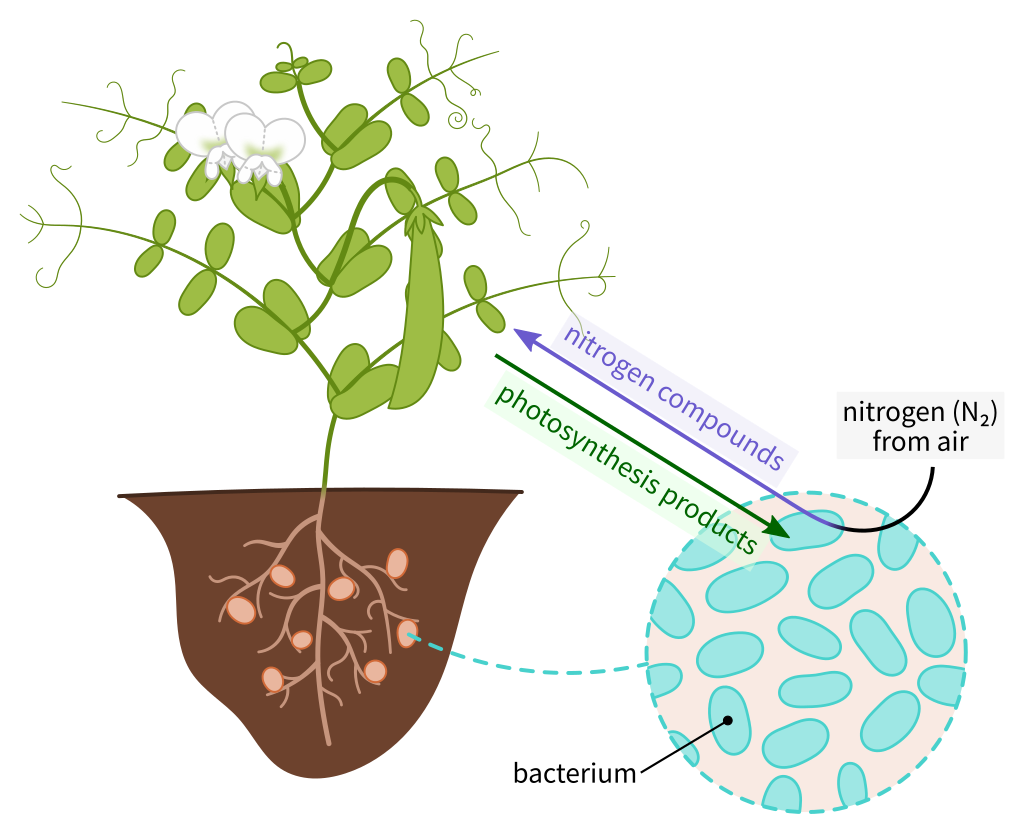
Figure 4: The soil bacteria Rhizobia form a partnership with legumes (peas, alfalfa, clover, beans, lupins, ect.) in which the bacteria change atmospheric nitrogen into a form of nitrogen that plants can uptake. Rhizobia form small growths on the plant roots called nodules where they produce the plant available nitrogen. When the plants die they release nitrogen into the soil environment, benefiting other plants (Nitrogen Fixation by Legumes).”
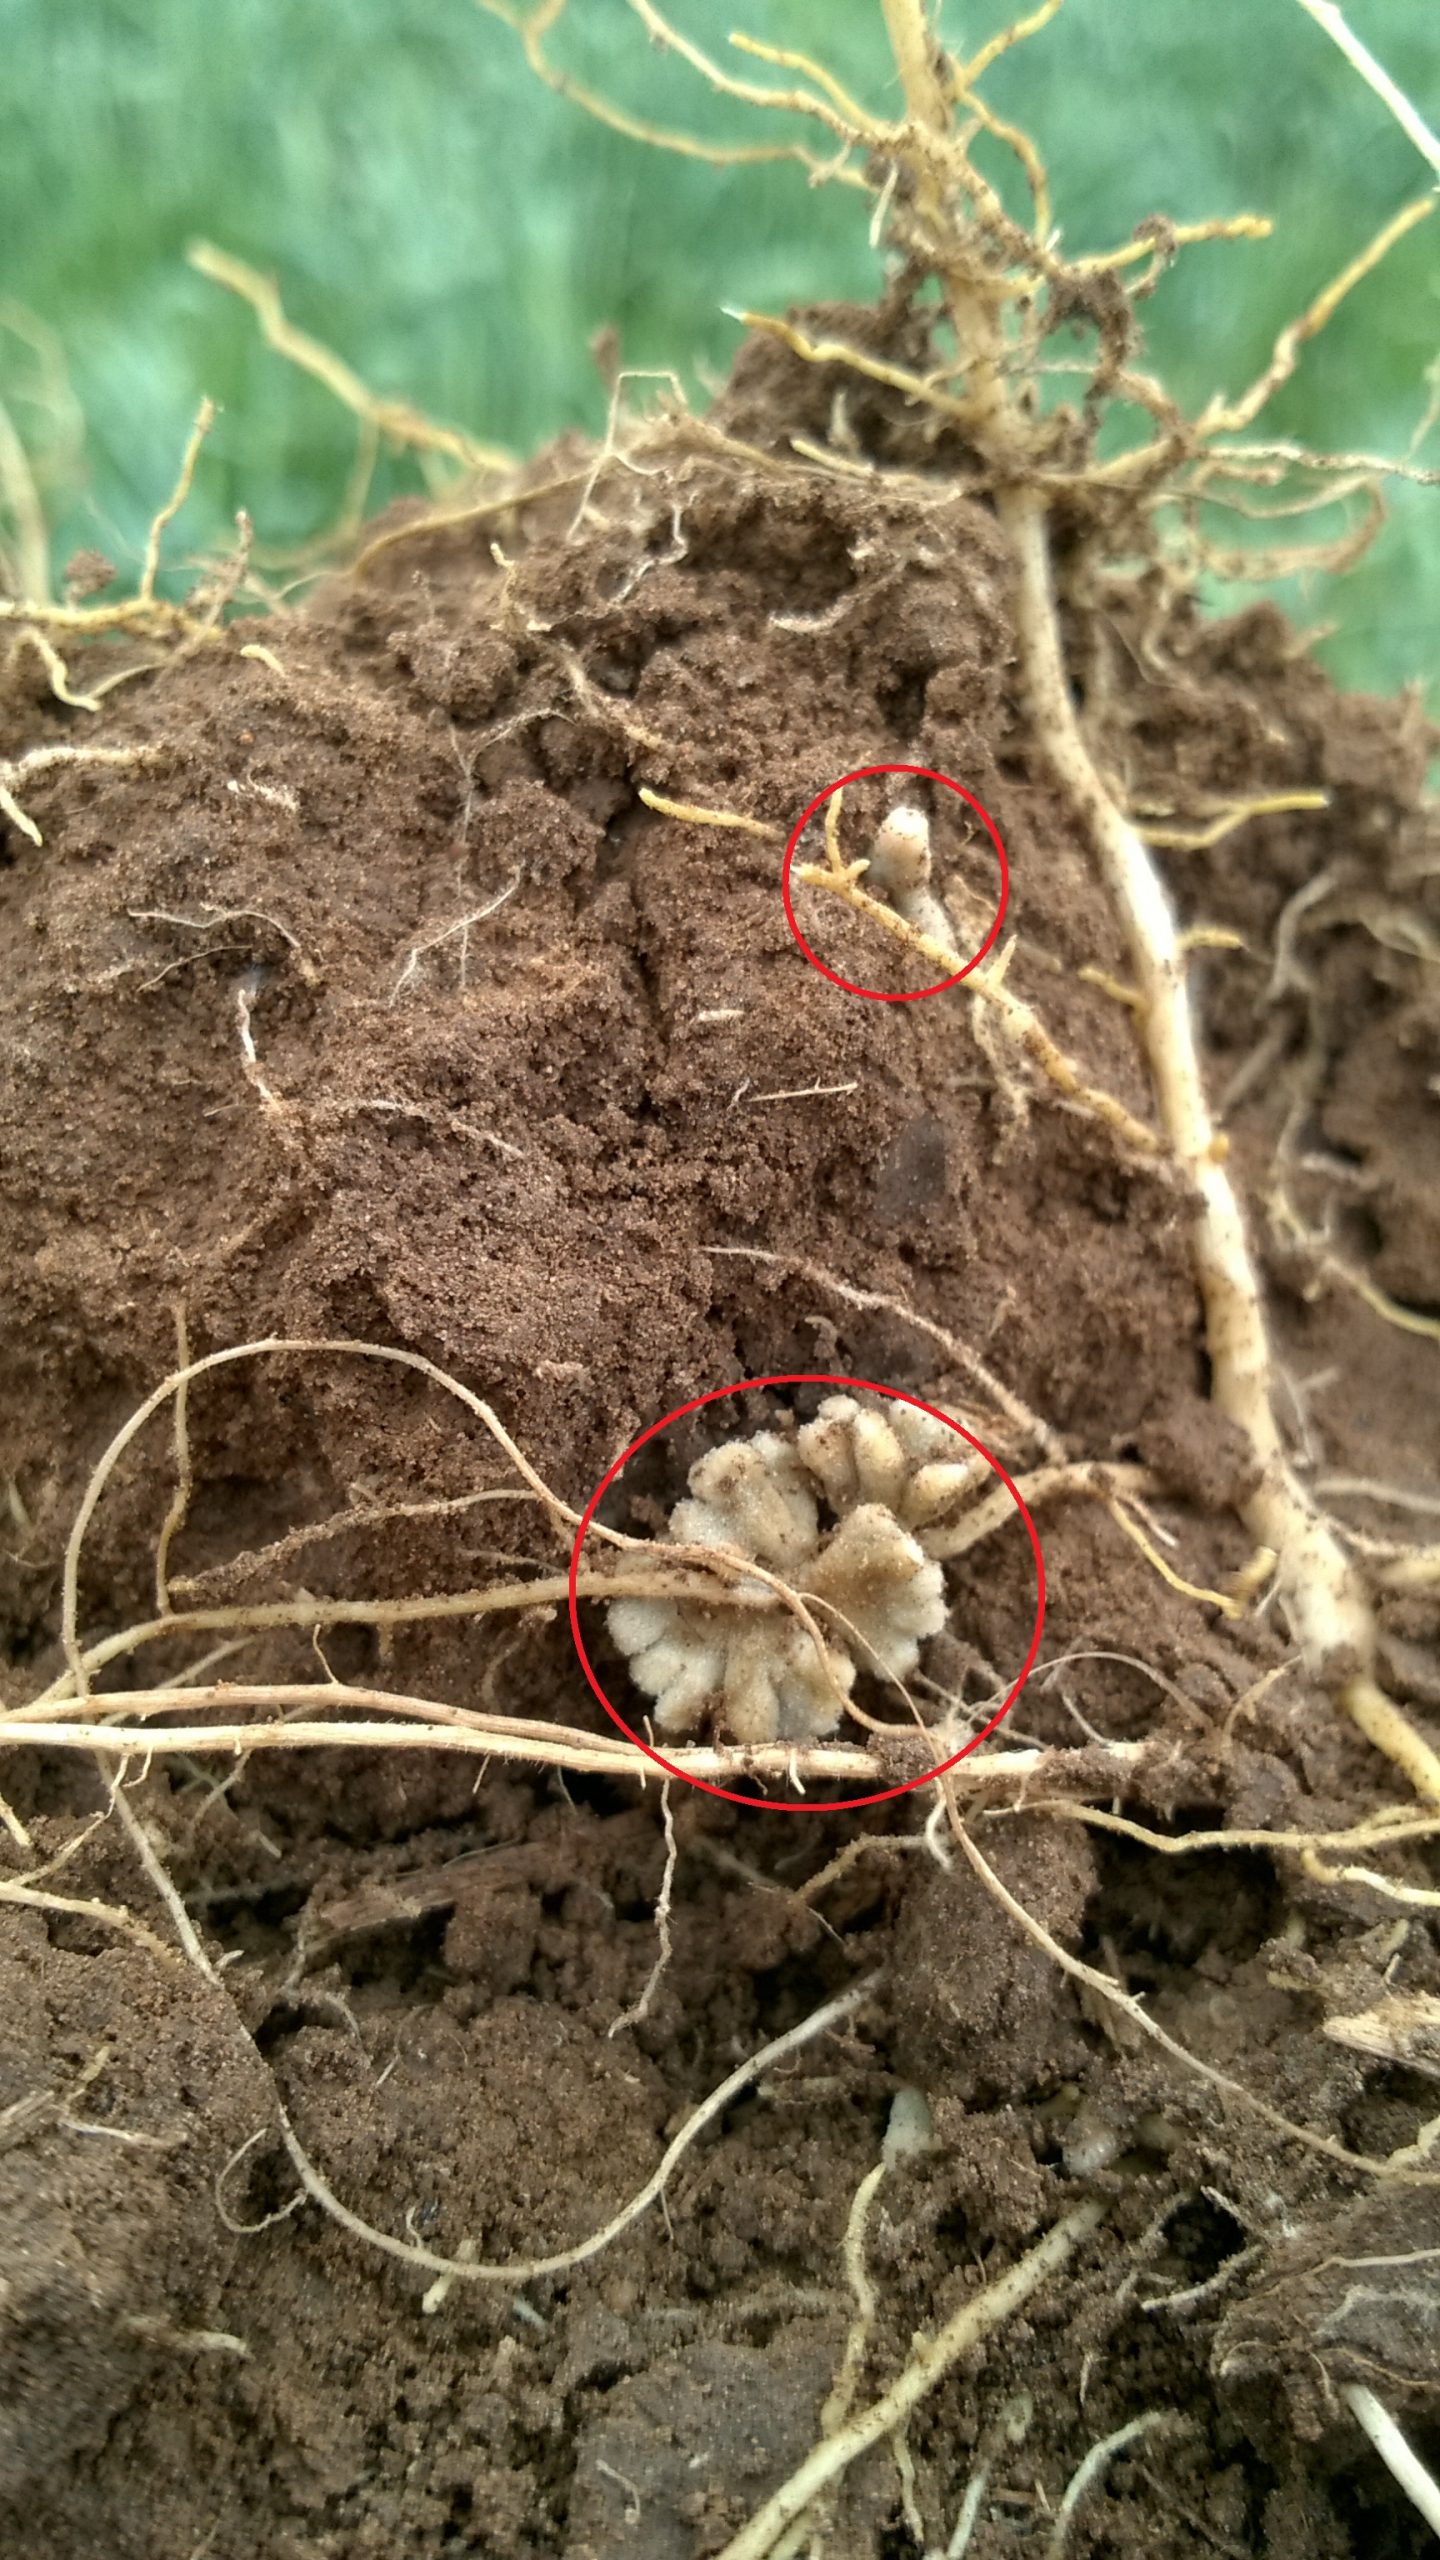
Figure 5: Root nodules (circled in red) on winter pea for nitrogen fixation. Source Rajan Ghimire – NMSU Agricultural Science Center Clovis NM.
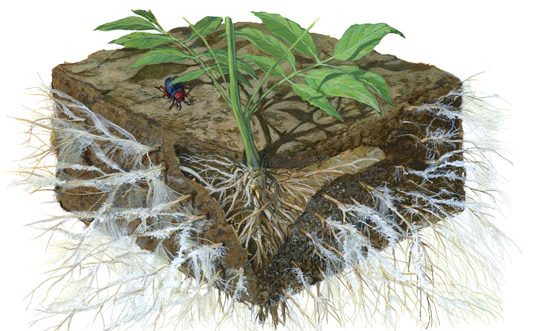
Figure 6: Beneficial soil fungi greatly aid plants in the uptake of soil nutrients via extensive fungal networks – depicted here as white outgrowths from the plant roots (Mycorrhizal Fungi).
Building healthy soil takes times. The following resources serve as a guide to obtain and maintain healthy soils. The resources are divided into 5 sections:
- Section 1: Explore the general properties of your soil online
- Section 2: Take a soil sample
- Section 3: Know what analysis to request and which laboratories to consider
- Section 4: How to interpret soil analyses
- Section 5: Suggested management practices to improve soil health
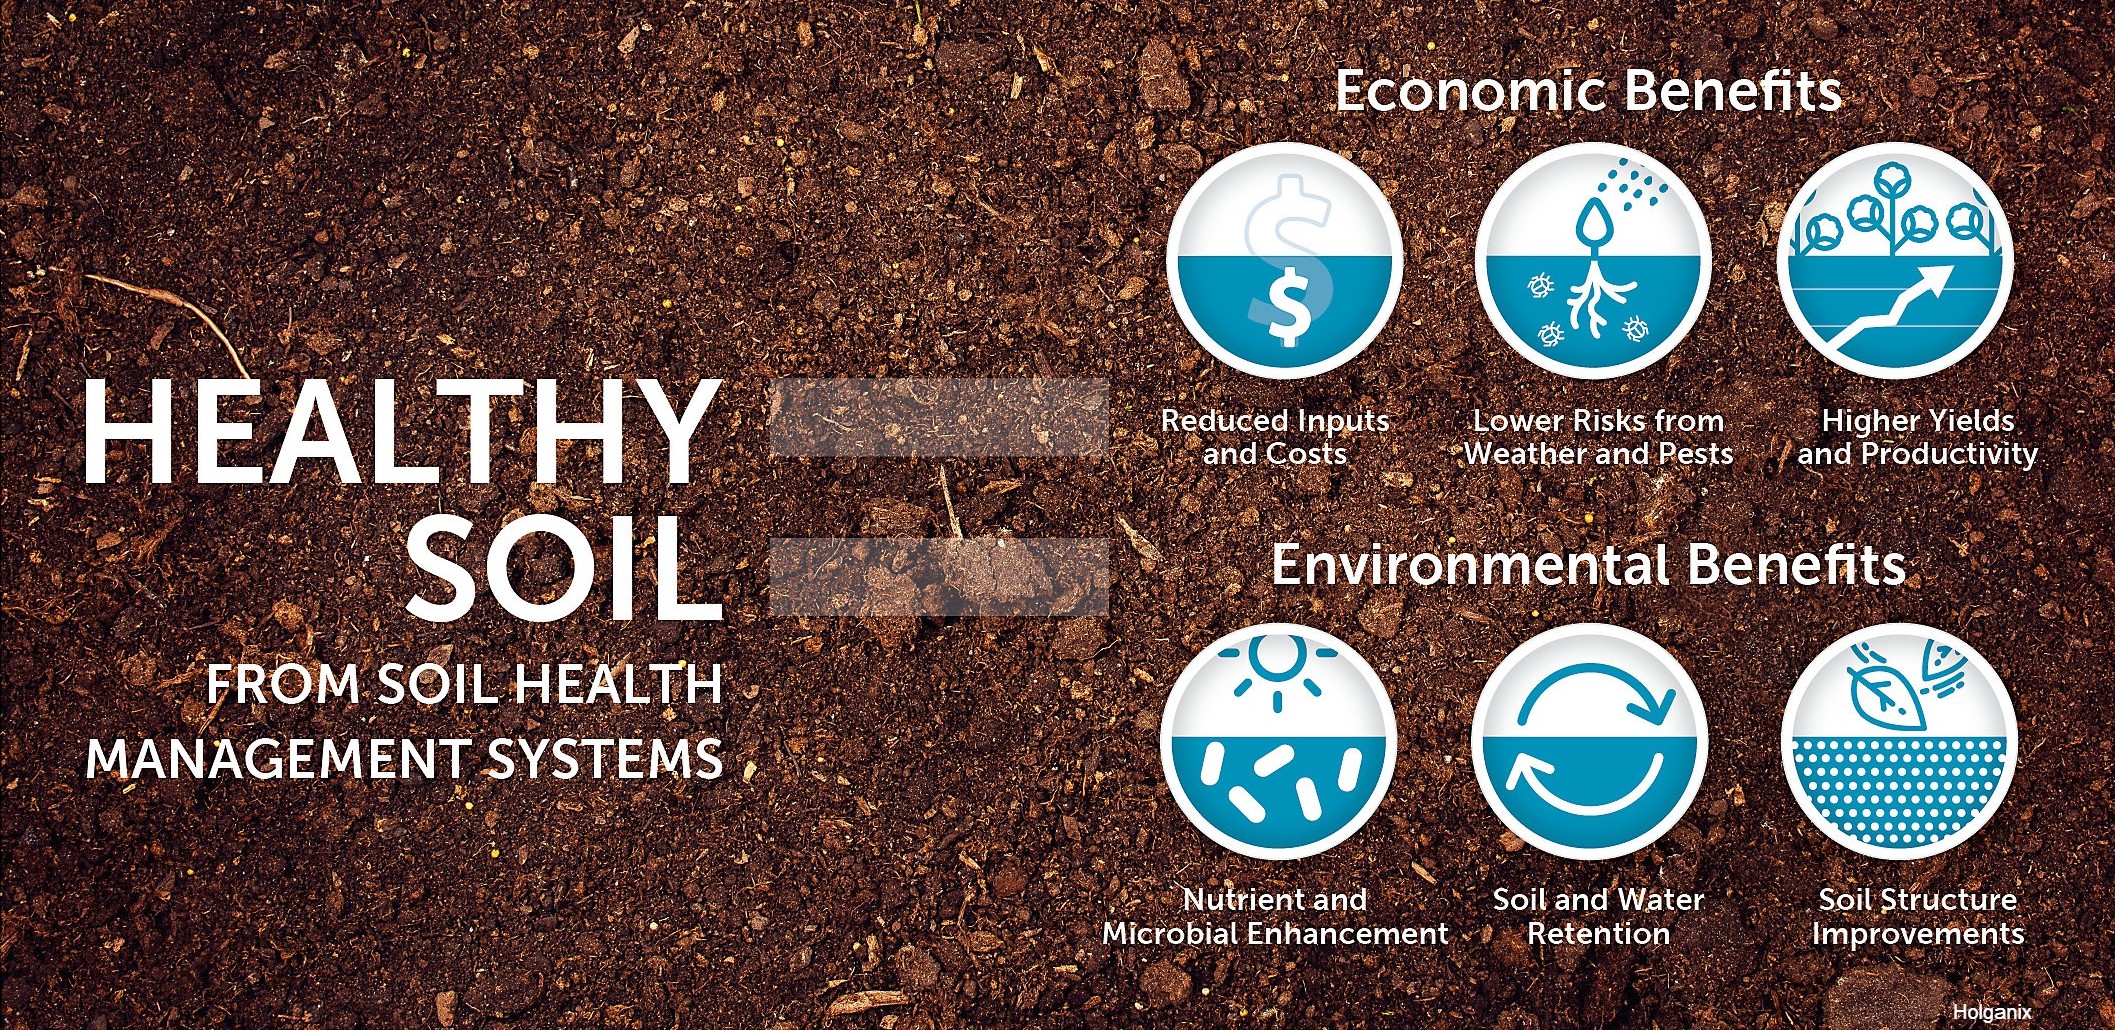
Sections 1-4 provide resources to understand the physical, chemical, and biological properties of the soil while section 5 provides resources to manage these properties to enhance the soil’s performance. By improving the soils capacity to function as a vital, living ecosystem that sustains plants, animals, and humans our production systems become more resilient to changes in water availability and weather extremes. In order to ensure productivity, increase income, and boost food security, it is vital to build and improve the soil health of New Mexico crop and rangelands (Soil Health-Importance, Assessment, and Management).
Section 1: Explore the general properties of your soil online
Website: Interactive Web Soil Survey
A great first step in understanding the properties of your soil is to explore the Web Soil Survey – operated by the USDA Natural Resources Conservation Service. The Web Soil Survey provides a free soil map (description of your soil) of your area of interest – be your farm, pasture, or even backyard. The information can be used for general planning purposes but you’ll need to do an onsite soil sample to both verify the information from the soil survey and to get more detailed, specific information about your soil (see Section 2). The soil map provides information on soil chemical properties (pH, cation-exchange capacity, ect.), soil health properties (available water capacity, organic matter, ect.) physical properties (texture, ect. ), depth to water table, drainage and more. Click –here– for an example of a soil survey report that can be generated from the site.
New Mexico has diverse soils. One of the most important soil characteristics to know is soil texture. Soil texture is important because it affects how much water soil can hold, how fast water can move through the soil, and how workable the soil is. The map displays the range of soil texture classes in Taos County (available on the Web Soil Survey) (Figure 1). Soil texture is the percent of clay, silt, and sand in soil (Figure 2). Clay, silt, and sand simply refer to the size of the soil particles. Clay particles are less than 0.002 mm, silt particles are between 0.05 to 0.002 mm, and sand particles are between 2.0 to 0.05 mm (Soil texture calculator) (Figure 3). When you hear the term “heavy soil” – that refers to a soil high in clay. When you hear the term “light soil” – that refers to a soil high in sand relative to clay (Soil texture). Clay soils hold more water than sandy soils, but are slow to drain and may have poor aeration. Sandy soils are well aerated but dont hold much water. Loam soils – those containing more sand and silt than clay – are ideal for gardening but are uncommon in New Mexico. Changing soil texture is difficult. Your best bet is to modify your soil by adding amendments, such as organic matter, that improves drainage in clay soils and water retention in sandy soils (Organic matter can make clay garden sols much more pleasant for gardening). You can verify the soil texture of area of interest from the Web Soil Survey by making a “soil ribbon” or by doing a “jar test.” For questions or more information, contact your local USDA Service Center at the following link: USDA Service Center or your NRCS State Soil Scientist at the following link: NRCS State Soil Scientist. Additional links of interest to explore NM soils: Geology of New Mexico, Penistaja New Mexico State Soil.
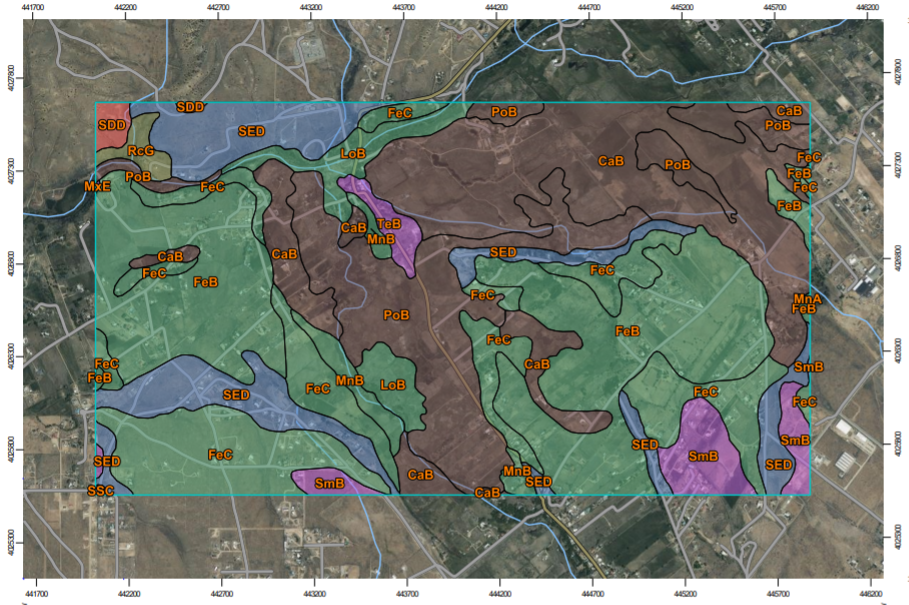
Figure 1: Soil texture map (Web Soil Survey Report).
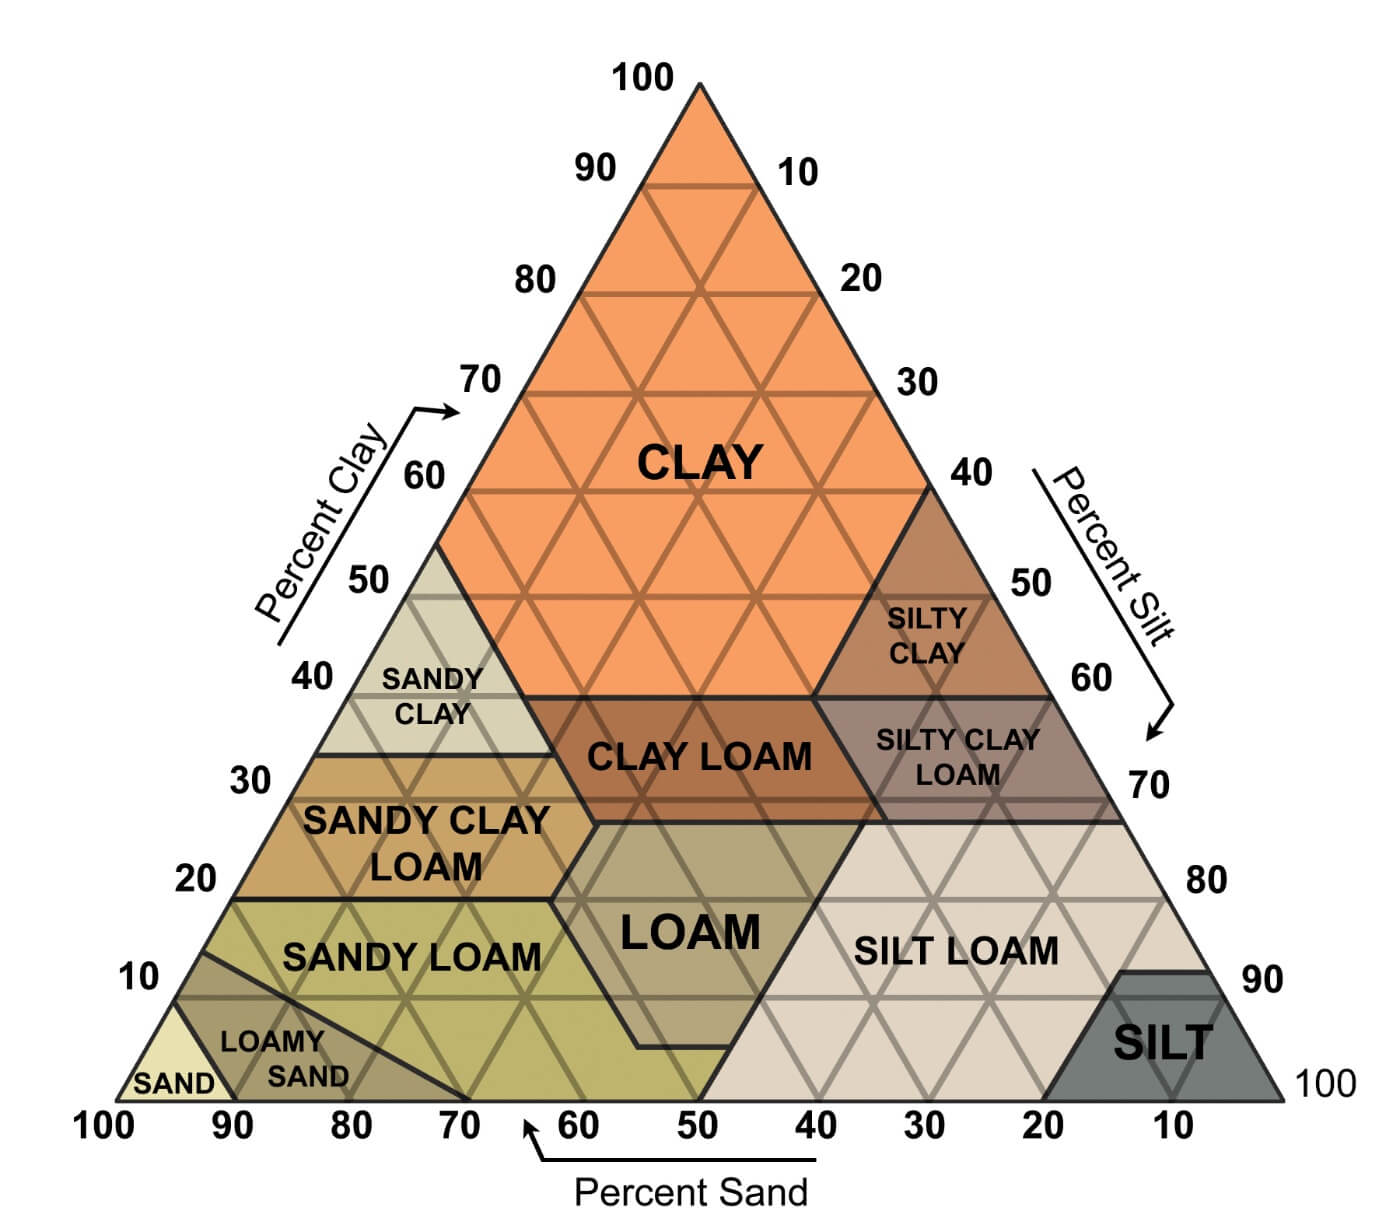
Figure 2: Soil texture triangle. To read the soil texture triangle, start with the known % sand and follow the line at that percent to where it intersects with the known % clay line or known % silt line. The texture name is given at the intersection point. For example, if you have 50% sand and 20% clay, you have a loam soil (Soil Textures). You can confirm your soil texture triangle reading by entering your % sand and % clay in the soil texture calculator and selecting “get type.”
Figure 3: Clay, silt, and sand particle size comparison (Soil Texture).
Section 2: Take a soil sample
Website: Test Your Garden Soil
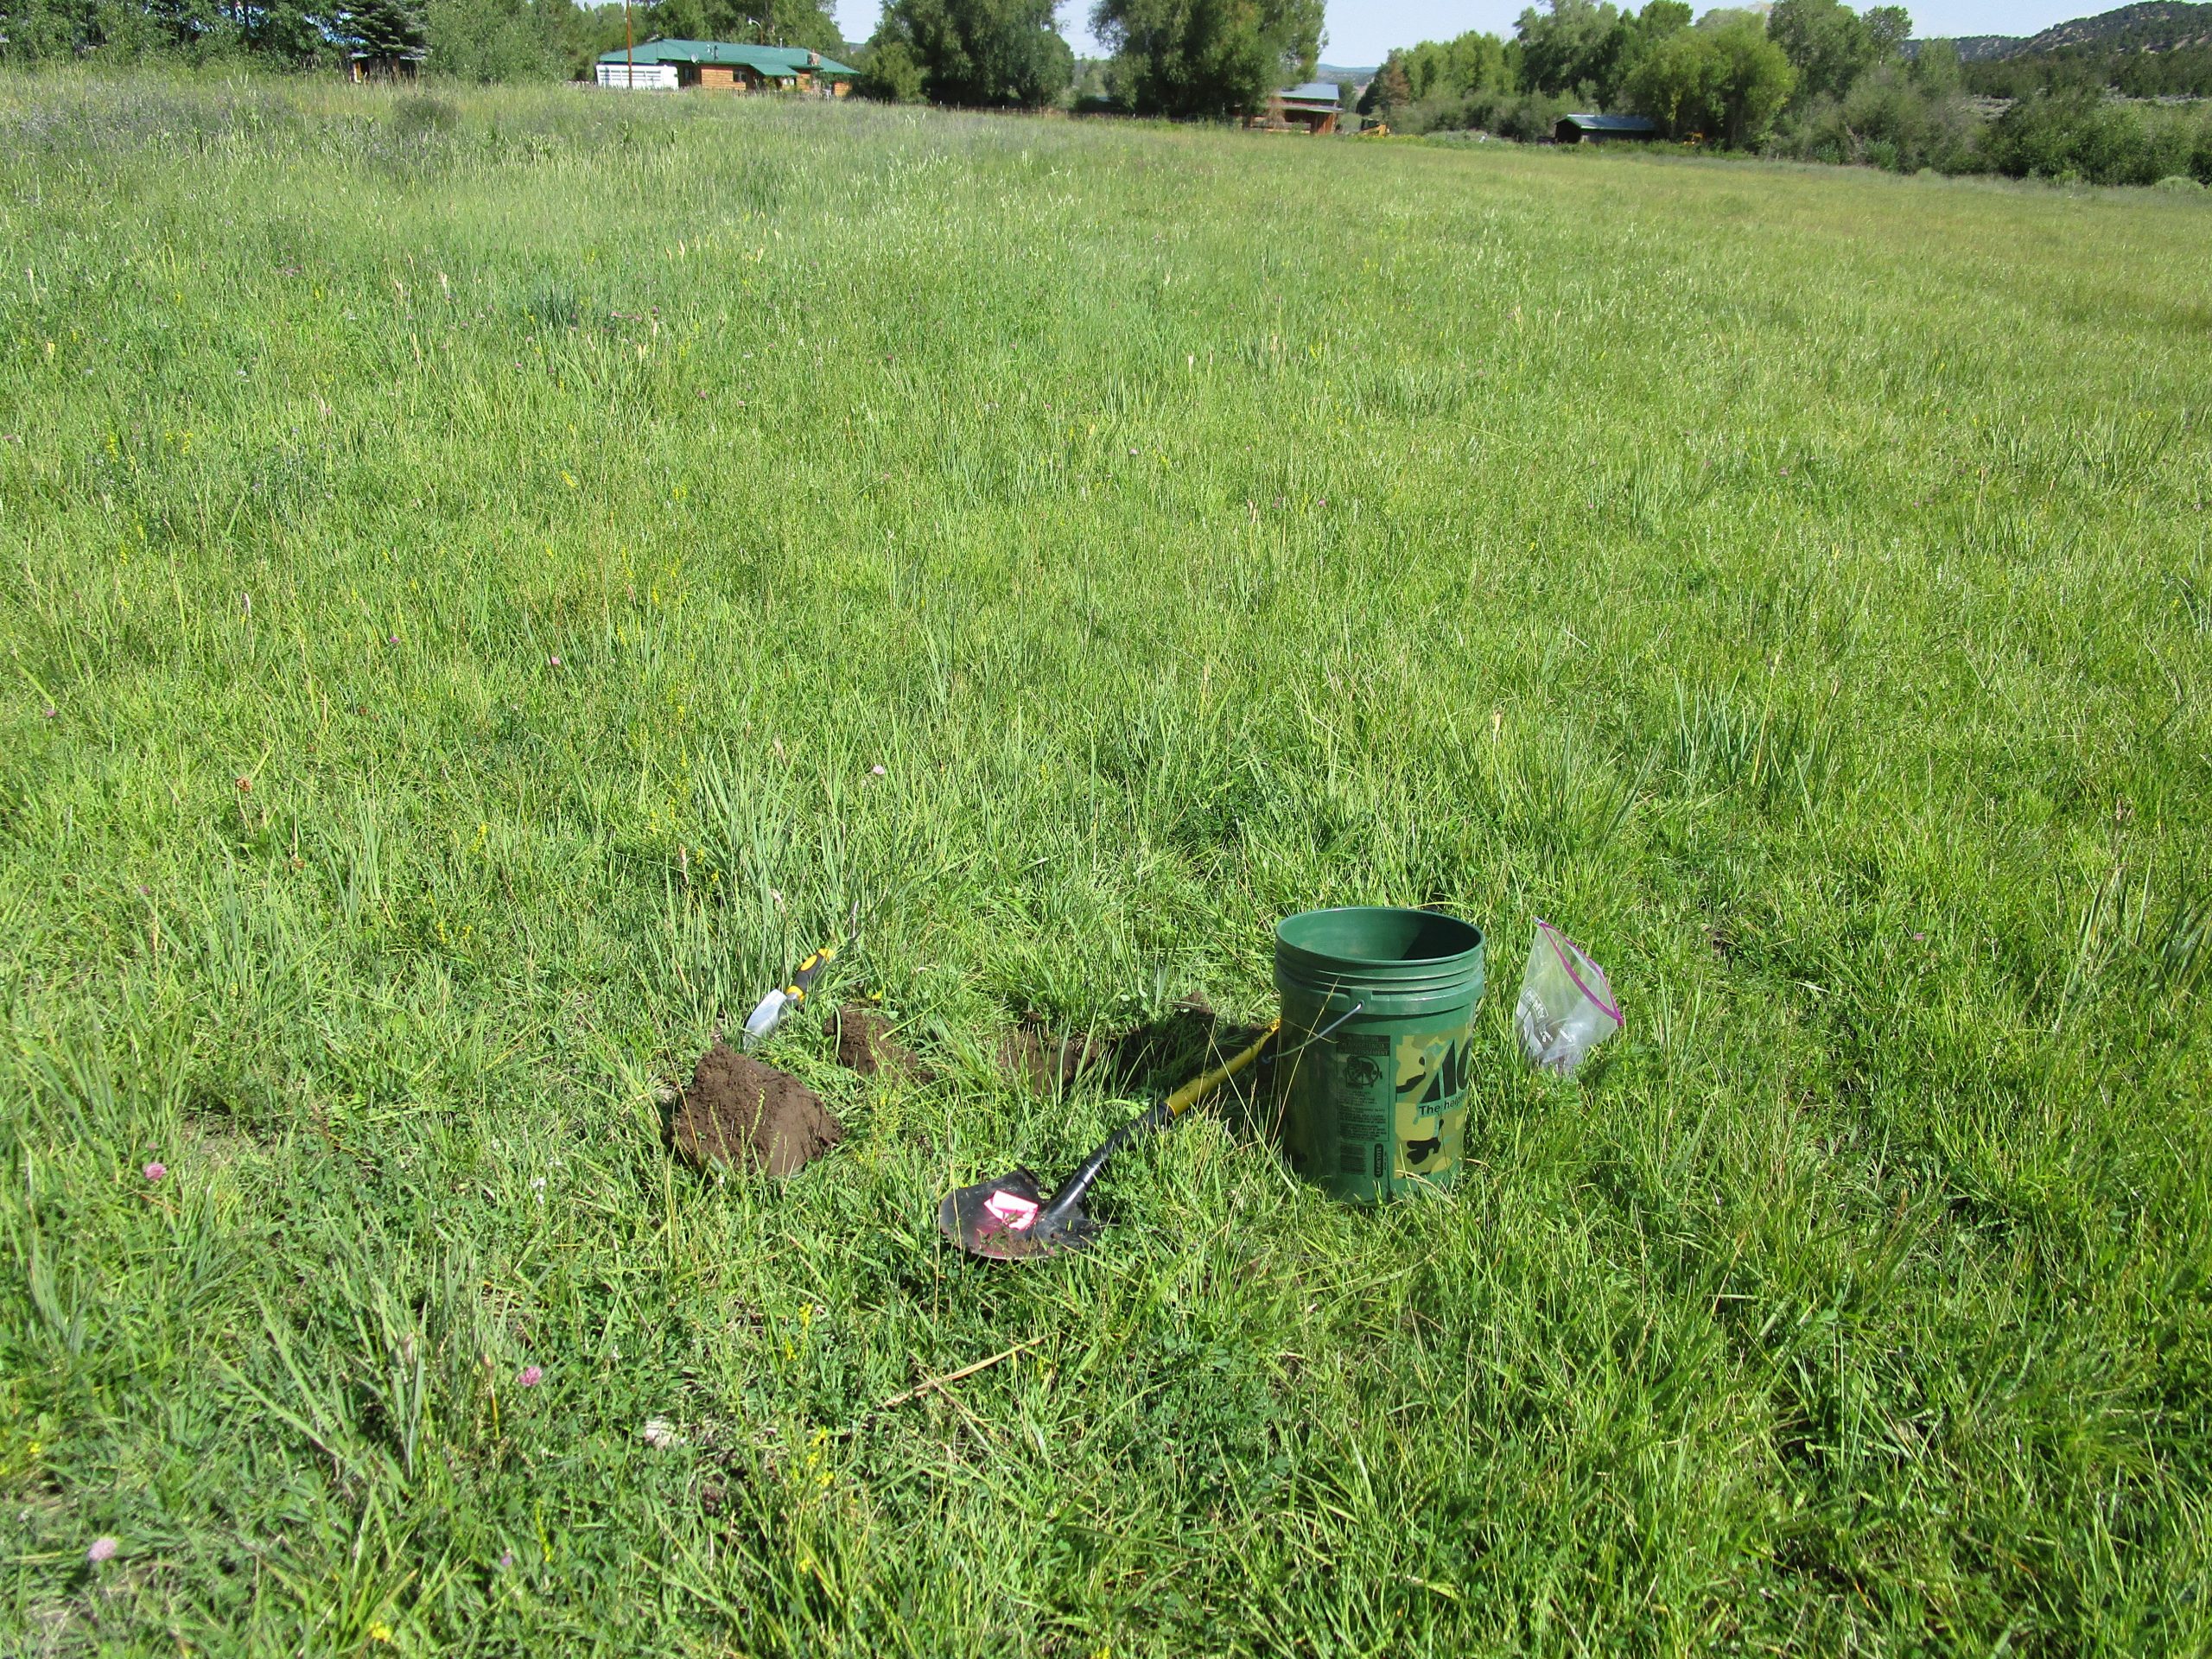
Photo credit Joaquin Anaya TSWCD.
To get specific, detailed information about your soil, you’ll need to do a soil test. Soil tests are based off soil samples from your garden or field. Soil tests provide information used in forming management recommendations (i.e. fertilizer recommendations). It’s advisable to test your soil at least every 3 years. Save past soil analyses to monitor changes from your management. It is important to take a representative sample that represents your garden or field’s soil. Samples that are not representative will likely be misleading. The following directions will guide you in taking a representative soil sample:
Supplies: 1) Shovel and knife or spade to take soil samples. Note* all equipment should be rust free. Rust from the equipment will contaminate the soil sample and give an inaccurate measurement of plant-available iron 2) Clean bucket or other suitable container for mixing soil sample. Note* do not use a metal container 3)Sealable plastic bags to hold the soil sample/s 4) Information form for each sample-provided by lab 5) Box to mail or transport soil sample to the laboratory. Procedure:
- For small areas (i.e. gardens) take samples from 5 or 6 randomly chosen areas. For large areas (i.e. fields) take up to 15 samples from randomly chosen areas. The samples from different management areas will be combined to send to the lab. Avoid areas near fence rows, compost piles, walkways, and fertilizer bands. Before digging up the soil, remove surface litter (straw, leaves, old stalks). Take all samples from the same depth (6″ for perennial plants, to tillage depth for annuals).
- Once all samples from an area have been collected, thoroughly mix them in your bucket or other suitable container. Break apart any large chunks of soil. Remove rocks, roots or other organic matter (woods chips, straw, ect.).
- Put 2 cups of mixed soil in the sealable bag. This sample will represent your area of interest. Label the bag and attach the information form. Make sure to keep a personal record of where you sampled from. Place sample/s in a box to be sent to the testing laboratory.
You can consult the laboratory for test result interpretations, your local county Extension agent or agronomy specialist (Test Your Garden Soil). Check out the following videos on soil sampling.
Section 3: Know what analyses to request and which laboratories to consider
Website: Appropriate Analyses for New Mexico Soils
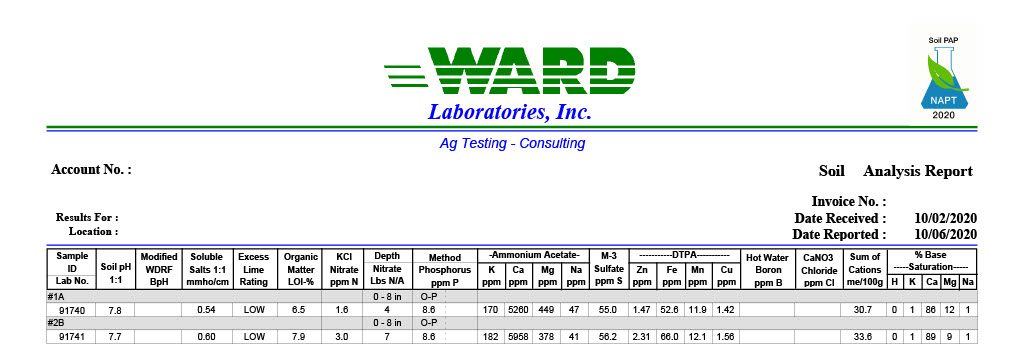
Soil is alive and complex. No single measurement can assess the health status of your soil. Multiple measurements need to be taken to understand the soil environment and should cover physical, chemical, and biological properties of your soil. Chemical properties relate to nutritional aspects of soil. Physical properties relate to the physical support provided by soil to crops. Biological properties relate to living and dead organisms in the soil. These properties are inter-related and are affected by management. Table 1 groups test results by whether they are a physical, chemical, or biological indicator of soil health. Table 2 lists the essential plant macronutrients (nutrients needed in greater quantities) and micronutrients (nutrients needed in smaller quantities) that are derived from soil (measured in the soil test) and derived from air and water (not measured in the soil test). Soil test results are interpreted to estimate the current health status of your soil and lead to management recommendations based on research to enhance your soil’s performance. Below table 2 is a sample soil analysis from Ward Laboratories, Inc. that shows measurements for soil chemical and biological indicators (Soil Health-Importance, Assessment, and Management).” Additional links of interest to assess soil health (including soil physical indicator measurements): Cropland In-Field Soil Health Assessment Worksheet
| Table 1: Soil health measurements | ||
| Soil physical indicators | Soil chemical indicators | Soil biological indicators |
| Soil compaction level (in field) | Soil macronutrients | Soil organic matter (SOM) |
| Soil bulk density (in field) | Soil micronutrients | Permanganate oxidizable carbon |
| Dry aggregate size distribution | Soil salinity | Nitrogen mineralization |
| Wet aggregate stability | Soil sodicity (sodium problem) | Carbon mineralization |
| Soil texture | Soil pH | Total microbial biomass |
| Available water capacity | Microbial biomass |
| Table 2: Essential plant nutrients from soil test | ||
| Macronutrients | Macronutrients | Micronutrients |
| From Air and Water | From Soil | From Soil |
| Hydrogen (H) | Nitrogen (N) | Iron (Fe) |
| Oxygen (O) | Phosphorus (P) | Manganese (Mn) |
| Carbon (C) | Potassium (K) | Boron (B) |
| Calcium (Ca) | Molybdenum (Mo) | |
| Magnesium (Mg) | Copper (Cu) | |
| Sulfur (S) | Zinc (Zn) | |
| Chloride (Cl) | ||
| Nickel (Ni) |
Section 4: How to interpret soil analyses
Website: Interpreting Soil Tests: Unlock the Secrets of Your Soil
When interpreting your soil analysis report it’s necessary to use the resources and procedures of the testing laboratory you submitted your sample to. The results provided by each lab are specific to the lab and lab region. The interpretations below are from Ward laboratories and New Mexico State University Extension.
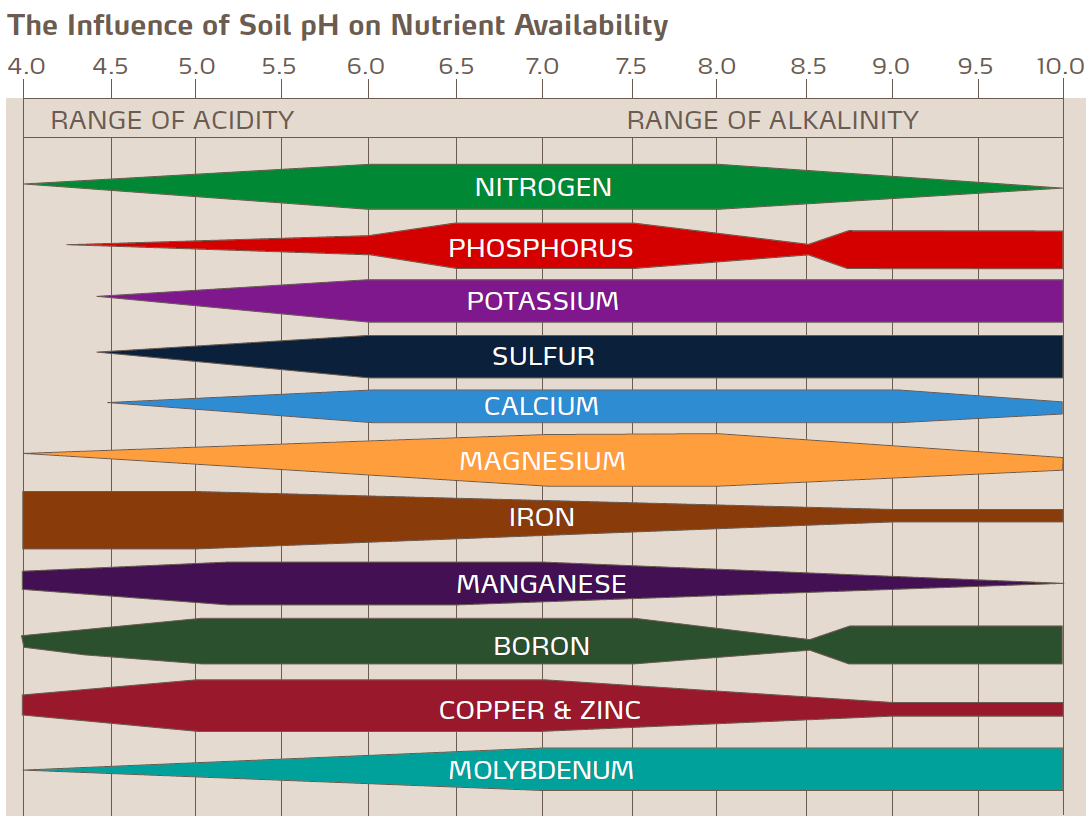 Soil pH: an indication of the acidity or alkalinity of a soil. The pH scale goes from 0-14. A pH reading < 5.4 is strongly acidic, 5.4 – 5.7 is moderately acidic, 5.8 – 6.2 is slightly acidic, 6.3 – 7.3 is neutral, and pH> 7.3 is alkaline (WARD Guide). Most crops will grow in soil with a pH between 6.2-8.3 (Interpreting Soil Tests: Unlock the Secrets of Your Soil). However, a soil pH of 6.5 is ideal. This is because soil pH affects soil nutrient availability and essential plant nutrients like phosphorus, zinc, and iron are more available around pH 6.5. (Appropriate Analysis for New Mexico Soils and Interpreting Soil Test Results). Figure 2: Plant nutrient availability across pH ranges (Yara). For more information on plant nutrition see Plant Nutrition and Fertilizers.
Typically soil pH is between 6.5 -8.4 in NM. Mountain soils that receive more rain (rain is naturally acidic) or gardens with too much organic matter, will often have a soil pH<7 (Appropriate Analysis for New Mexico Soils and Interpreting Soil Test Results). Generally, lime should be applied if soil pH<6 in order to increase soil pH (How to Read a Soil Test Report). Soils with free calcium carbonate (lime) will often have a soil pH>7 (Interpreting Soil Tests: Unlock the Secrets of Your Soil). In NM, many soils have lime-which controls soil pH. To test for the presence of lime, pour a little vinegar on your soil at different depths. If the soil bubbles it likely has enough lime to keep the pH above 7.5. In order to lower the pH, elemental sulfur can be added. However amendments can be costly and an alternative to lowering the pH is choosing alkaline (high pH) tolerant plants, like the perennial forages Cicer milkvetch (Astragalus cicer) or Strawberry clover (Trifolium fragiferum)(Perennial Forage Species for Irrigated Pastures and Hay in New Mexico).
Soluble Salts 1:1 mmho/cm: Soil salts come from the weathering of soil minerals and irrigation water. Common soluble (dissolved) salts are the positively charged ions (cations): sodium (Na), calcium (Ca), magnesium (Mg) and potassium (K), and the negatively charged ions (anions): carbonate (CO3), bicarbonate (HCO3), chloride (Cl), sulfate (SO4) and nitrate (NO3). Because the ions are charged (positive ions=cations, negative ions=anions), they conduct an electric current. The more ions in the soil solution, the higher the electric current. The electrical conductivity reading is calibrated to give the soluble salt level in the unit millimhos per centimeter (mmho/cm). As the electrical conductivity reading increases, so does the salinity hazard. Soluble salt readings between 0 – 1.0 mmho/cm indicate no crop hazard, 1.1 – 1.5 mmho/cm indicate yield reduction on sensitive crops, 1.6 – 3.5 mmho/cm indicate moderate to severe yield reduction, and 3.6 mmho/cm + indicate severe yield reduction (WARD Guide). Figure 1: Salt tolerance of selected crops in New Mexico (An Introduction to Soil Salinity and Sodium Issues in New Mexico).
| Common name | Botanical name | Threshold (mmhos/cm) | Rating |
| Alfalfa | Medicago sativa | 2 | Moderately sensitive |
| Ryegrass, perennial | Lolium perenne | 5.6 | Tolerant |
| Wheat | Triticum aestivum | 8.6 | Tolerant |
| Apricot | Prunus armeniaca | 1.6 | Sensitive |
Excess lime rating: Lime (calcium carbonate) increases pH. If excess lime is present, either plants tolerant of alkaline (high pH) soils will have to be selected or a soil amendment, such as elemental sulfur, will need to be added to lower the soil pH (Appropriate Analyses for New Mexico Soils and Interpreting Soil Test Results). Additionally, low or high excess lime may be problematic for plant health with certain herbicides (i.e. atrazine) if they are affected by high lime or high pH so check for potential interactions when applying herbicides (How to Read a Soil Test Report). Excess may also cause chlorosis (yellowing) in the plant tissue due to iron deficiency.
Organic Matter LOI-%: Soil organic matter (OM) is determined by the loss of ignition (LOI) method. OM comes from decayed plants and animals that are decomposed by soil microbes (WARD Guide). The OM is integrated into the topsoil where is serves as a nutrient reservoir for crops, helps to improve water infiltration and moisture retention, reduces compaction and surface crusting (Soil Organic Matter). There is typically 30 lbs N/acre provided per growing season for each %OM (Interpreting Soils Tests: Unlock the Secrets of Your Soil).
| Organic Matter Range | Soil Textural Class | |||
| % | Loamy Sand | Sandy Loam | Loam | Silt Loam |
| <0.5 | Very low | Very low | Very low | Very low |
| 0.5-1.0 | Low | Very low | Very low | Very low |
| 1.0-1.5 | Medium | Low | Very low | Very low |
| 1.5-2.0 | High | Medium | Low | Very low |
| 2.0-2.5 | Very high | High | Medium | Low |
| 2.5-3.0 | Very high | Very high | Medium | Medium |
| 3.0-4.0 | Very high | Very high | High | Medium |
| 4.0-5.0 | Very high | Very high | Very high | High |
| >5.0 | Very high | Very high | Very high | Very high |
| Clay, Clay Loam | Sandy Clay, Silty Clay, Silty Clay Loam | Sand | Silt | |
| <0.4 | Very low | Very low | Low | Very low |
| 0.4-0.8 | Very low | Very low | Low | Very low |
| 0.8-1.3 | Very low | Very low | Medium | Low |
| 1.3-1.8 | Low | Low | Medium | Medium |
| 1.8-2.3 | Low | Low | High | Medium |
| 2.3-2.8 | Medium | Medium | High | High |
| 2.8-3.3 | Medium | Medium | Very high | High |
| >3.3 | High | High | Very high | High |
(Interpreting Soils Tests: Unlock the Secrets of Your Soil).
KCl Nitrate ppm N: measures the amount of nitrate (NO3-) in parts per million (ppm) left in the soil and available for the next crop. Nitrate comes from organic matter, crop residue, manure, and from fertilizers with anhydrous ammonia (NH3), urea (CH4N2O), or ammonia salts ((NH4)2SO4) (WARD Guide). Because nitrate is highly soluble (easily dissolves in water) and is prone to leaching, it’s recommended to split the nitrogen fertilizer application over the course of the growing season. The table below shows the interpretation for nitrate for most crops (Interpreting Soils Tests: Unlock the Secrets of Your Soil).
| Parts Per Million | Classification |
| <10 | Deficient for most crops |
| 10-20 | Low |
| 20-30 | Moderate |
| 30-50 | Sufficient |
| >50 | Excessive |
Depth Nitrate Lbs N/A: Pounds nitrogen per acre is calculated by multiple Nitrate ppm N by 0.3 by sampling depth. Example: 11 ppm N x 0.3 x 8 in sampling depth =26.4 lb N per acre.
For reference, the average nitrogen removal by established alfalfa at harvest is 50 lbs/ton (Shapiro and Anderson). In 2018, the average alfalfa hay yield in NM was 4.70 tons/acre (Annual Crop Summary 2018). This corresponds to a N removal of 4.7 tons/acre x 50 lbs/ton = 235 lbs N/acre.
To calculate the amount of nitrogen to apply in lbs per acre subtract the amount of N measured from the soil plus N from other sources (legumes, manure, irrigation) from the nitrogen requirement for your crop (crop yield x N req (Table 1)). Note* If a subsoil nitrate test is not available, assume it to be 5 ppm NO3-N for fine textured soils and 2 ppm NO3-N for sandy soils.
𝑁 𝑙𝑏𝑠/𝐴 = (𝐶𝑟𝑜𝑝 𝑦𝑖𝑒𝑙𝑑 𝑥 𝑁 𝑟𝑒𝑞) − (𝑝𝑝𝑚 𝑡𝑜𝑝𝑠𝑜𝑖𝑙 𝑁𝑂3 𝑁 𝑥 0.3 𝑥 𝑑𝑒𝑝𝑡ℎ 𝑖𝑛 𝑖𝑛𝑐ℎ𝑒𝑠) − (𝑝𝑝𝑚 𝑠𝑢𝑏𝑠𝑜𝑖𝑙 𝑁𝑂3 𝑁 𝑥 0.3 𝑥 𝑑𝑒𝑝𝑡ℎ 𝑖𝑛 𝑖𝑛𝑐ℎ𝑒𝑠) − 𝑙𝑒𝑔𝑢𝑚𝑒 𝑐𝑟𝑒𝑑𝑖𝑡 − 𝑚𝑎𝑛𝑢𝑟𝑒 𝑐𝑟𝑒𝑑𝑖𝑡 − 𝑖𝑟𝑟𝑖𝑔𝑎𝑡𝑖𝑜𝑛 𝑤𝑎𝑡𝑒𝑟 𝑐𝑟𝑒𝑑𝑖𝑡
Use nitrogen fertilizer efficiently by applying the correct amount in order to conserve energy and protect ground water. 100 pounds of nitrogen has an energy equivalent of 19 gallons of diesel fuel due to the energy required to manufacture, deliver and apply nitrogen (WARD Guide).
| Crop | Nitrogen Required | Subsoil Factor |
| Corn | 1.1 lbs/bushel (bu) | 0.3 |
| Milo (Sorghum) | 1.15 lbs/bu | 0.3 |
| Feed-Hay | 25 lbs/ton | 0.3 |
| Pinto Beans | 1.45 lbs/bu | 0.3 |
| Winter Wheat | 2.4 lbs/bu | 0.3 |
| Spring Wheat | 2.4 lbs/bu | 0.3 |
| Oats | 1.3 lbs/bu | 0.3 |
| Rye | 1.9 lbs/bu | 0.3 |
| Alfalfa | 0 | 0 |
| New Alfalfa | 5 lbs/ton | 0.3 |
| Grass Alfalfa | 20 lbs/ton | 0.3 |
| Clover | 0 | 0 |
Phosphorus ppm P: Phosphorus (P) comes from soil organic matter and minerals. If your soil analysis report says O-P, then the Olsen HCO3-P test was used to estimate the amount of available phosphorus, otherwise the Mehlich P-3 test was used.
| Mehlich P-3/Bray P-1 (ppm P) | Olsen P (ppm P) | Rating | % Sufficiency |
| 0-5 | 0-3 | Very low | 25-60 |
| 6-12 | 4-8 | Low | 45-80 |
| 13-25 | 9-16 | Medium | 70-95 |
| 26-50 | 17-31 | High | 90-100 |
| >50 | 31+ | Very high | 100 |
For a soil test with 80% sufficiency, the soil will supply 80% of the phosphorus the plant requires and added fertilizer will be needed to supply the rest. If no phosphate is added, the yield will be 80% of its yield possibility. Phosphate fertilizer applications should always be made on soils testing very low and low in phosphorus (WARD Guide).
Potassium ppm K: Potassium (K) comes from weathered soil minerals such as clay. The more clay, the more K. However, only 1 – 8% of the total K is in a form that is available to plants (WARD Guide).
| Soil K Test, ppm K | Sufficiency (%) |
| 0-40 | 20-50 |
| 41-80 | 45-80 |
| 81-120 | 70-95 |
| 121-200 | 90-100 |
| >200 | 100 |
Calcium ppm Ca: Many minerals in the earth’s crust contain calcium. Apatite, calcite, and dolomite derived soils are typically high in Ca. Soil Ca can range from 250 to over 5,000 ppm without apparent harm to plants. Ca fertilizer requirement is associated with soil pH. Lime may be required to increase soil pH if calcium is relatively low. The table below shows expected levels of Ca across pH. If soil pH < 6.0, the expected Ca ppm is greater than 750 ppm. If soil pH 6.0-7.2, the expected Ca ppm is 1200-3500 ppm. If soil pH 7.3-8.3, the expected Ca ppm is 3500-5500 ppm (WARD Guide).
Magnesium ppm Mg: Magnesium (Mg) comes from weathered soil parent materials. Most soils contain high levels of magnesium; therefore, yield responses to magnesium fertilizer application are uncommon (WARD Guide).
| Mg Soil Test, ppm | Rating | Comments |
| 0-25 | Low | Magnesium deficiency symptoms may be general in most field crops, vegetables and fruits. Magnesium fertilization is advised. |
| 26-50 | Medium | Magnesium deficiencies are expected in sugar beets, potatoes, and fruit crops. Magnesium fertilization is strongly advised for these crops. Cereal crops would not be expected to respond consistently. |
| 51-100 | High | Magnesium deficiency is not expected in vegetable crops. Magnesium fertilization is suggested for fruit crops. A Mg soil test in the low, medium, and high ranges suggests some grass tetany problems for grazing cattle. |
| >101 | Very High | No magnesium deficiencies are expected. |
Sodium ppm Na: Recall, sodium (Na) is a soil salt. It is one of many salts measured by the Soluble Salts reading (see above). The Na value is used in calculations with calcium (Ca) and magnesium (Mg) to determine if the soil is salt-affected. In arid and semi-arid regions, salt affected soils are common (WARD Guide). Salinity is measured not only by EC, but also sodium adsorption ratio (SAR) and exchangeable sodium percentage (ESP). Based on the values of EC, SAR, and ESP soils are either normal, saline, sodic or saline-sodic. Saline soils limit plant growth and sodic soils harm soil structure. SAR is calculated as follows: SAR=Na(meq/L)/sqrt(Ca(meq/L)+Mg(meq/L))/2. To convert SAR to ESP, use the following equation: ESP=(1.475*SAR)/(1+(0.0147*SAR)) (Flynn and Ulery CR 656).
| Criteria | Normal | Saline | Sodic | Saline-Sodic |
| EC (mmho/cm) | <4 | >4 | <4 | >4 |
| SAR | <13 | <13 | >13 | >13 |
| ESP (%) | <15 | <15 | >15 | >15 |
Sulfate ppm S: Sulfur (S) mainly comes from organic matter decay in the soil, but also from soil minerals, gaseous SO2 in the atmosphere, and irrigation water. Plants absorb sulfur in the form of sulfate (SO4(2-)) (WARD Guide). If the plant available sulfate (S) to plant available nitrogen (N) ratio is less than 15:1, soils are considered S sufficient (Flynn, Ulery, and Lindemann CR 650).
To calculate the amount of sulfur to apply in lbs per acre subtract the amount of S measured from the soil (multiply the ppm reading by 0.3 and by soil depth) and other S sources (OM sulfur, irrigation water S) from the sulfur requirement for your crop (crop yield x S req). Note – If the irrigation water contains more than 8 ppm SO4-S, then an increase in yield is not expected with a sulfur fertilizer application. Typically, cereal grains will remove 15 lbs of S per acre while forage and row crops will remove 15 to 35 lbs of S per acre (WARD Guide).
Micronutrients Zinc (Zn), Iron (Fe), Manganese (Mn), Copper (Cu): These nutrients are needed in smaller quantities but are no less essential than macronutrients for plants to grow, reproduce, and complete their life cycle. Micronutrient deficiencies are more likely to be a problem in sandy soils because of small quantities of micronutrients in sands and very alkaline soils (pH>7.3) because of low availability of micronutrients in high pH soil (WARD Guide).
| Alfalfa, Clover, Small Grains | Beans and Corn | Sorghums, and Misc. | |
| Zinc Rating | |||
| Very low | 0.00-0.25 | 0.00-0.15 | |
| Low | 0.00-0.25 | 0.26-0.50 | 0.16-0.30 |
| Medium | 0.26-0.50 | 0.50-1.00 | 0.31-0.60 |
| High | >0.51 | >1.00 | >0.61 |
| Iron Rating | |||
| Low | 0.00-2.50 | 0.00-2.50 | 0.00-3.50 |
| Medium | 2.60-4.50 | 2.60-6.00 | 3.60-10.00 |
| High | >4.50 | >6.00 | >10.0 |
| Manganese Rating | |||
| Low | 0.00-1.00 | 0.00-1.00 | 0.00-1.00 |
| Medium | 1.10-3.00 | 1.10-3.00 | 1.10-3.00 |
| High | >3.00 | >3.00 | >3.00 |
| Copper Rating | |||
| Low | 0.00-0.10 | 0.00-0.10 | 0.00-0.10 |
| Medium | 0.11-0.20 | 0.11-0.20 | 0.11-0.20 |
| High | 0.21-0.60 | 0.21-0.60 | 0.21-0.60 |
| Very High | >0.60 | >0.60 | >0.60 |
CEC/Sum of Cations me/110g: Cation Exchange Capacity (CEC) is an indicator of the soils potential to retain cations (positively charged ions that are also plant nutrients i.e. potassium K+, magnesium Mg+2, calcium Ca+2, ammonium NH4+, sodium Na+) and supply them to crops. CEC is the exchange of cations between the soil solution, clay, humus, and plant roots. Generally, CEC increases with clay content and organic matter. CEC is measurement in milliequivalents per 100 grams. The table below gives common CEC ranges by soil texture (WARD Guide).
| Soil texture | CEC, meq/100g |
| Sands | <6 |
| Fine sandy loams | 5-10 |
| Loams and silt loams | 9-18 |
| Clay loams | 15-25 |
| Clays | >22 |
% Base Saturation: Percent base saturation is the amount of CEC occupied by the bases potassium (K), calcium (Ca), magnesium (Mg) and sodium (Na). These bases neutralize the soil acidity caused by the cations hydrogen (H) and aluminum (Al). For example, if a percent base saturation of a soil is 80, then four-fifths of the CEC is occupied by the bases and one-fifth by hydrogen and aluminum. To calculate the % base saturation divide soil test level (ppm) by milliequivalent/100 g soil (see table below). Then divide that value by the Sum of Cations value (provided in the soil analysis report) and multiply the answer by 100. Example 294 ppm Mg/120=2.4/18.4=0.3×100=3 % Base Saturation Mg. Note*the table below gives the milliequivalent/100 g soil for the base cations (Calculating Cation Exchange Capacity, Base Saturation, and Calcium Saturation). If % Base Saturation Na >5% apply 500 lbs gypsum and if Na<5%, no action is required (WARD Guide).
| Base Cation | Atomic Weight | Charge (Valence) | Gram Equivalent Weight (g) | Milliequivalent/100 g soil |
| Calcium (Ca) | 40 | 2 | 20 | 200 |
| Magnesium (Mg) | 24 | 2 | 12 | 120 |
| Potassium (K) | 39 | 1 | 39 | 390 |
| Sodium (Na) | 23 | 1 | 23 | 230 |
Section 5: Suggested management practices to improve soil health
Website: Understanding Soil Health for Production Agriculture
Healthy soils improve crop production and are less prone to degradation and erosion. Suggested methods to improve soil health are: reduced tillage, cover cropping and green manure, crop rotation, organic amendments, and organic matter accumulation.
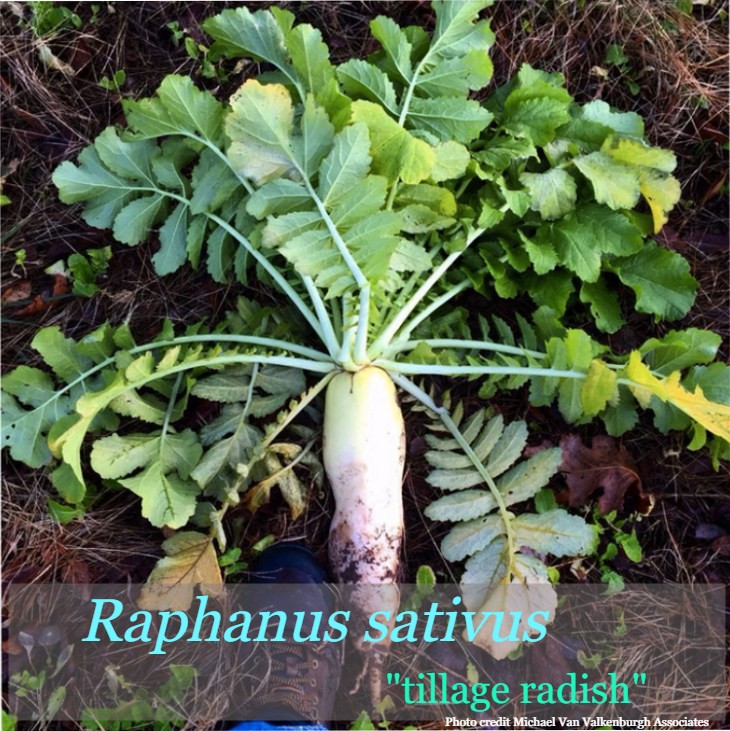
Reduced tillage: Conventional plow disk tillage breaks down soil organic matter more rapidly and to a greater extent than reduced tillage. Reduced tillage (no till, strip-till or zone-till) allows for more organic matter to build in the soil over time (Understanding Soil Health for Production Agriculture). Recall, organic matter serves as a nutrient reservoir, improves water infiltration, and water retention. The video below compares the breakdown or oxidation of organic matter in the soil between conventional and reduced tillage systems. You will see there is more organic matter in reduced tillage systems. In addition to the benefits to soil health, reduced tillage also requires less fuel, labor, and maintenance than conventional tillage (Zone/Strip Tillage). An excellent cover crop option in reduced tillage systems is the forage radish Raphanus sativus. This radish helps to break up compacted soils, retain moisture, and reduce erosion. These plants are not harvested, but are instead allowed to die and decay in the soil in order to leave a nitrogen store and root channels for improved air flow (Radishes: A New Cover Crop Option).
Cover cropping and green manure: Cover crops can grow between cash crop production, can be intercropped with cash crops, or can be planted instead of a normal crop. The purpose of cover crops is to protect the soil from erosion and nutrient loss, enhance soil structural stability, conserve water, suppress weeds, insect and disease, and increase organic matter that bolsters soil microbial communities and diversity. Cover crops can serve as green manures (grown when field is not in use and later incorporated into the soil for added nutrients and organic matter), living mulches (grown for living ground cover throughout growing season for weed suppression and erosion protection), residue mulches (killed cover crop left on soil surface for weed suppression and pest management), catch crops (grown after cash crop to reduce nutrient loss in soil) and forages (grown for grazing and can be used as green manure if killed and incorporated into the soil) (Cover Crops and Green Manures). Cover crops build soils that are more resilient to extreme environments like droughts. The provided websites summarize cover crop production, benefits, and challenges in NM: Cover Crop Considerations: Meeting Your Garden Needs, Principles of Cover Cropping for Arid and Semi-arid Farming Systems. The video below showcases the benefits of brassicas (radishes, turnips, mustards, rapeseed) as cover crops. For financial assistance with cover crop plantings check out the Environmental Quality Incentives Program through the USDA NRCS.
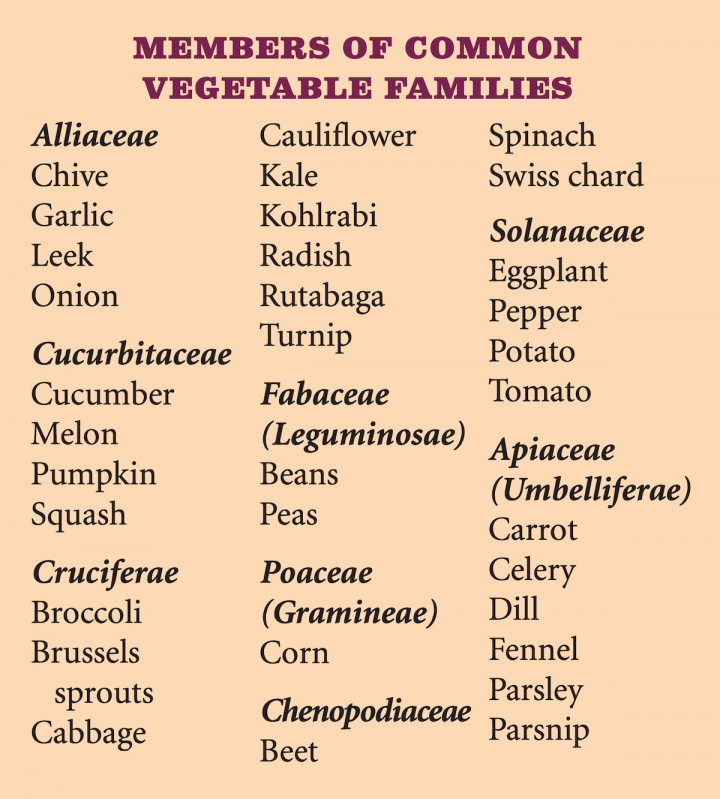
Crop rotation: Crop rotation is the order of crop cultivation. A best management practice is to alternate crops from different plant families (a plant family is a taxonomic rank and indicates a group of related plants) from season to season. The purpose of crop rotation is to reduce soil borne diseases and improve soil health (Understanding Soil Health for Production Agriculture). For example, the “three sisters” corn (from the plant family Poaceae), squash (from the plant family Cucurbitaceae), and beans (from the plant family Fabaceae) can be rotated through adjacent plots season to season (The Sisterhood Tradition: Three Sisters Companion Planting). The idea is that each plant will benefit the soil for the next plant (the beans for example will add nitrogen to the soil) and that if there is any disease problem of one plant species, the next plant species will not be vulnerable because of its different genetic makeup. Photo Crop Rotation Chart for Small Vegetable Garden.
Organic amendments: Organic amendments include manure and compost. The purpose of organic amendments is to increase the amount of soil organic matter and improve soil health. The composition of organic amendments can vary widely. It is therefore important to send the organic material to a laboratory for analysis to understand the nutrient content and to get an idea of how much to apply (Understanding Soil Health for Production Agriculture). The table shows the varying amounts of nitrogen (N), phosphorous (P), and potassium (K) across different types of animal manure. Note – manure analyses usually report in terms of P and K while fertilizer labels use P2O5 (phosphate) and K2O (potash). To convert from P to P2O5 multiply P by 2.3. To convert from K to K2O multiply K by 1.2 (Manure on Your Farm: Asset or Liability?).
| Type of Animal Manure | Nitrogen (lb/ton) | Phosphorus (lb/ton) | Potassium (lb/ton) |
| Chicken with litter | 73 | 28 | 55 |
| Laying hen | 37 | 25 | 39 |
| Sheep | 18 | 4 | 29 |
| Rabbit | 15 | 4.2 | 12 |
| Beef | 12 | 2.6 | 14 |
| Dry stack dairy | 9 | 1.8 | 16 |
| Separated dairy solids | 5 | 0.9 | 2.4 |
| Horse | 9 | 2.6 | 13 |
Organic matter accumulation: More organic matter in the soil allows water to be absorbed more easily and quickly. In Taos where water is scarce, water absorption is important for soils to withstand long periods of drought. In addition to the practices described, the integration of livestock also promotes soil organic matter accumulation. Livestock increase the activity, diversity and size of microbial communities that are integral in nutrient cycling. The availability of nutrients like nitrogen, phosphorus, and sulfur are enhanced by grazing because of greater decomposition rates of plant residues and by hoof actions because of increase in residue contact with the soil. Be mindful not to overgraze (high-intensity grazing of limited resources) because soil health could be negatively impacted by excessive trampling because of increased compaction, aggregation breakdown and reduced water infiltration (Soil Health-Importance, Assessment, and Management). Photo credit Joaquin Anaya TSWCD.